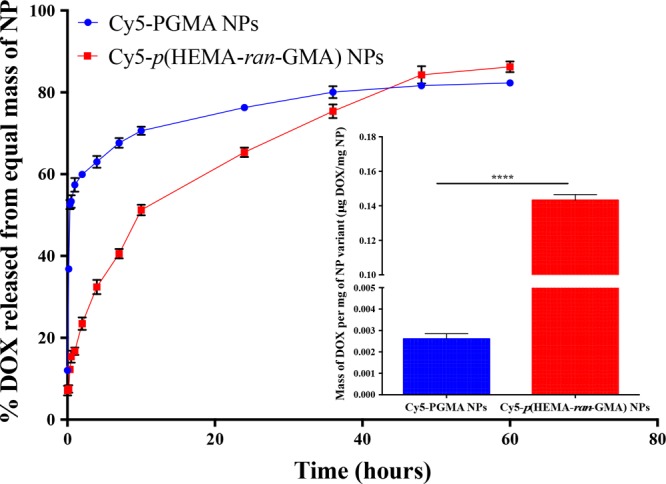
Figure 3.

Doxorubicin (DOX) release profiles from Cy5-PGMA and Cy5-p(HEMA-ran-GMA) nanoparticles (NPs) assessed using high-performance liquid chromatography (HPLC) (sink volume = 10 mL; 200 μL sample assessed at each time point). Inset graph: DOX loading efficiency (DOX mg/nanoparticle mg ± standard error of measurement (SEM)). Statistical analysis by unpaired t test; ****p < 0.0001. n = 3 for both DOX loading and release profile measurements.
