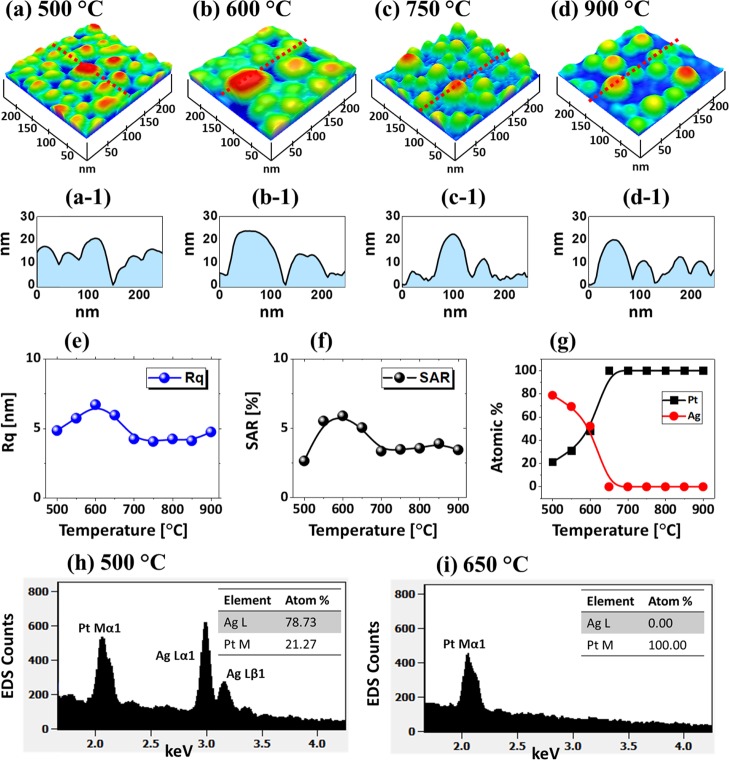
Figure 2.
Evolution of AgPt and Pt nanoparticles (NPs) on sapphire (0001) from the Ag7.5nm/Pt3.75nm bilayers annealed between 500 and 900 °C for 120 s. (a–d) Atomic force microscopy (AFM) side views of 250 × 250 nm2. (a-1–d-1) Cross-sectional line profiles of the NPs. (e, f) Summary plots of RMS roughness (Rq) and surface area ratio (SAR), respectively. (g) Summary of atom % of Ag and Pt. (h, i) Energy-dispersive X-ray spectroscopy (EDS) spectra of the AgPt and Pt NPs fabricated at 500 and 650 °C, respectively.

