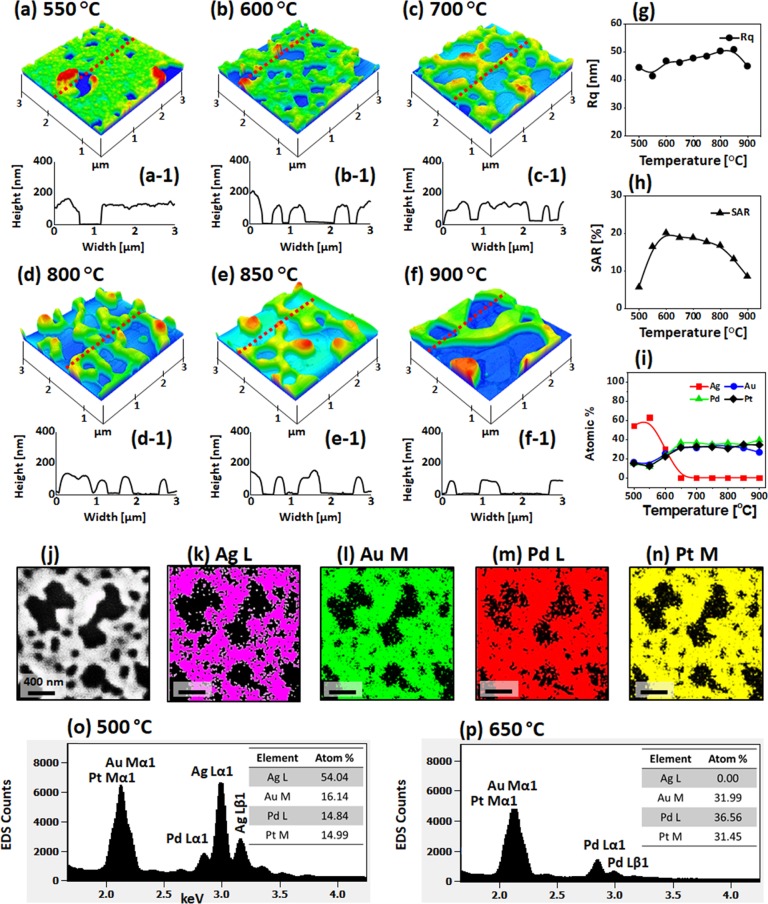
Figure 6.
Evolution of large AgAuPdPt and AuPdPt alloy NPs from Ag40nm/Au15nm/Pd15nm/Pt15nm quad-layers by annealing between 550 and 900 °C for 120 s. (a–f) AFM side views of 3 × 3 μm2. (a-1–f-1) Cross-sectional line profiles. (g–i) Summary plots of Rq, SAR, and atom % of Ag, Au, Pd, and Pt, respectively. (j–n) SEM image and elemental maps of Ag, Au, Pd, and Pt for alloy nanoclusters fabricated at 600 °C, respectively. (o, p) EDS spectra of the AgAuPdPt and AuPdPt alloy NPs at 500 and 650 °C, respectively.

