
Fig. 2.
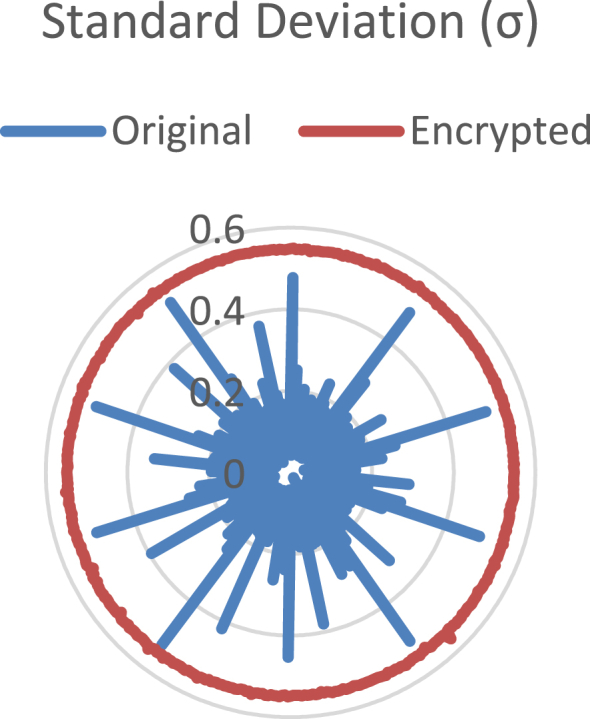
Radial plot of the standard deviation. The blue line corresponds to the original audio data, the red line to the encrypted data.
Official websites use .gov
A
.gov website belongs to an official
government organization in the United States.
Secure .gov websites use HTTPS
A lock (
) or https:// means you've safely
connected to the .gov website. Share sensitive
information only on official, secure websites.
Radial plot of the standard deviation. The blue line corresponds to the original audio data, the red line to the encrypted data.