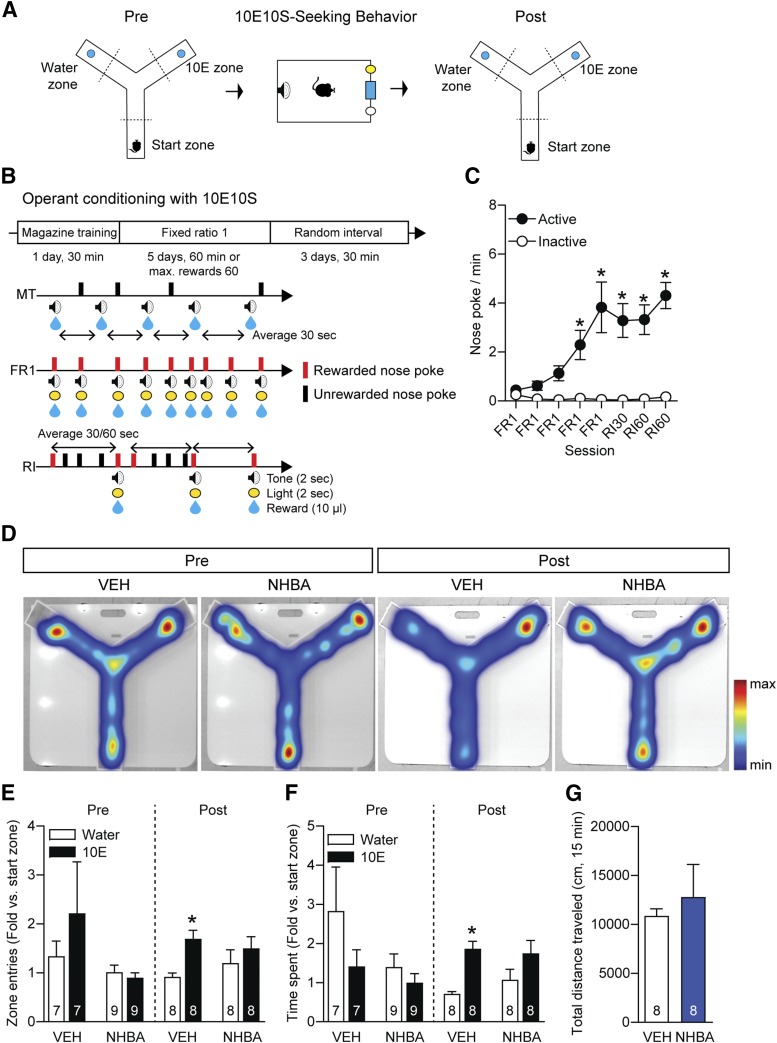
Fig. 2.
Effects of NHBA on ethanol preference before and after training with ethanol-containing reward. (A and B) Experimental scheme. (C) Nose-poking behavior (n = 11/group). (D) Heat map depicting mice tracking patterns for 15 minute on the Y-maze. (E) Zone entries and (F) time spent in each zone of the Y-maze (n = 7/VEH + Pre, n = 9/NHBA + Pre, n = 8/post groups). (G) Total distance traveled for 15 minutes among groups (n = 8/groups). Data represented as mean ± S.E.M. *P < 0.05, (C) comparing the first FR1 session and (E and F) comparing the water zone of the same treatment group. (C) Two-way repeated measures ANOVA followed by Bonferroni’s multiple comparisons test, (E and F) one-way repeated measures ANOVA followed by Bonferroni’s multiple comparisons test, and (G) unpaired Student’s t test.

