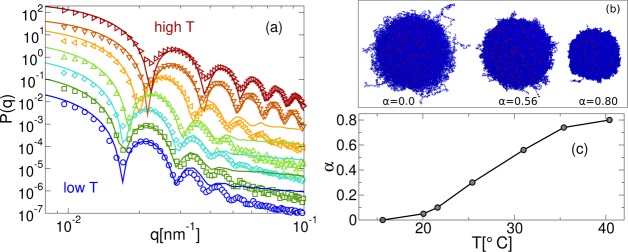
Figure 4.
(a) Comparison between experimental (empty symbols) and numerical (eq 2, full lines) form factors for N ≈ 336 000. The x-axis is rescaled by γ = qexp*/qsim = 0.2326, where q* is the position of the first peak of P(q). Different colors correspond to different temperatures, T and solvophobic parameters, α, increasing from bottom to top: T = 15.6, 20.1, 21.6, 25.4, 31.0, 35.4, 40.4 °C in experiments and α = 0.00, 0.05, 0.10, 0.30, 0.56, 0.74, 0.80 in simulations. Data at different T, α are rescaled on the y-axis with respect to the lowest temperature in order to help visualization; (b) snapshots of the N ≈ 336 000 microgels for α = 0.0, 0.56, 0.80 with monomers represented in blue and crosslinkers in red; (c) mapping between T and α.

