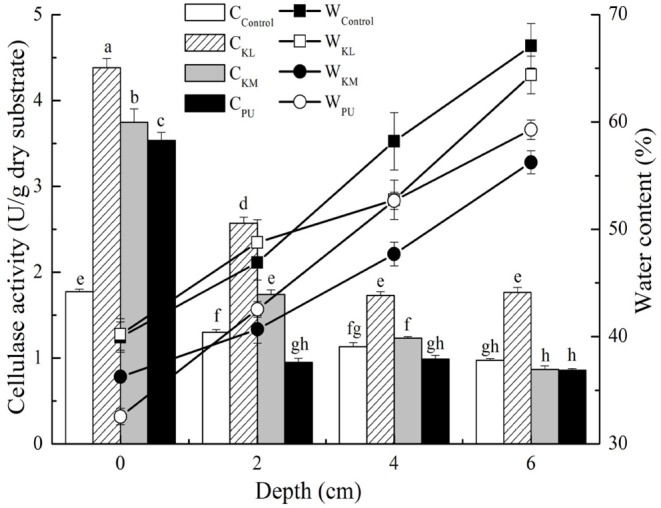
Figure 3.

Effect of WRMs types on cellulase production. Bars represent standard errors and different letters above the histogram indicate significant differences (P < 0.05) according to Tukey test.

Effect of WRMs types on cellulase production. Bars represent standard errors and different letters above the histogram indicate significant differences (P < 0.05) according to Tukey test.