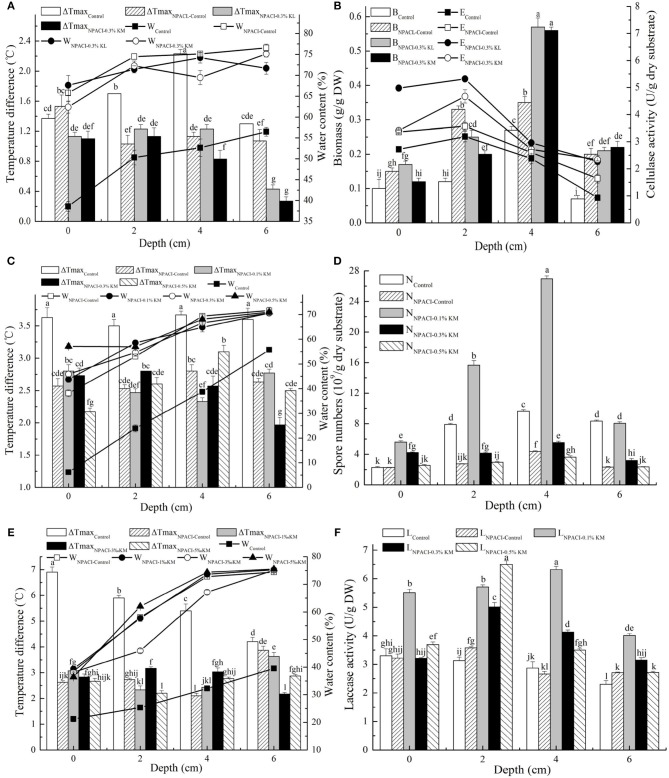
Figure 6.
Parameters difference in three model strains fermentation by NPACI controlling. (A,C,E) Maximum temperature difference and MC under different bed depths in three model strains fermentation; (B) biomass and enzyme activities under different bed depths after cellulase production; (D) spore number under bed depths after T. harzianum culture; (F) laccase activity under bed depths after fermentation. Bars represent standard errors and different letters above the histogram indicate significant differences (P < 0.05) according to Tukey test.

