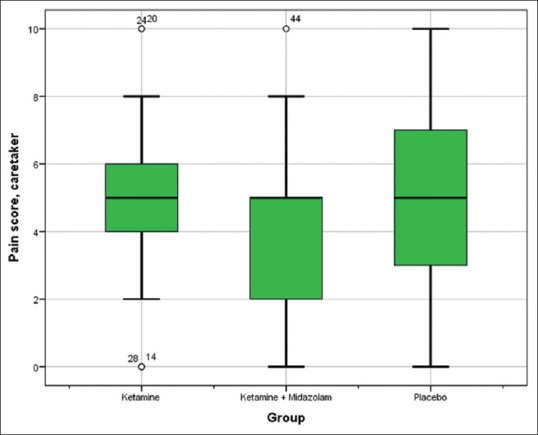
Figure 2.

Box plot diagram of the dispersion of caretaker-reported pain score. Interquartile range (IQR = Q3 - Q1) is represented by the box. Outliers are defined as >1.5 interquartile range from the nearest quartile. Whiskers stretch to the largest/smallest value that is not an outlier
