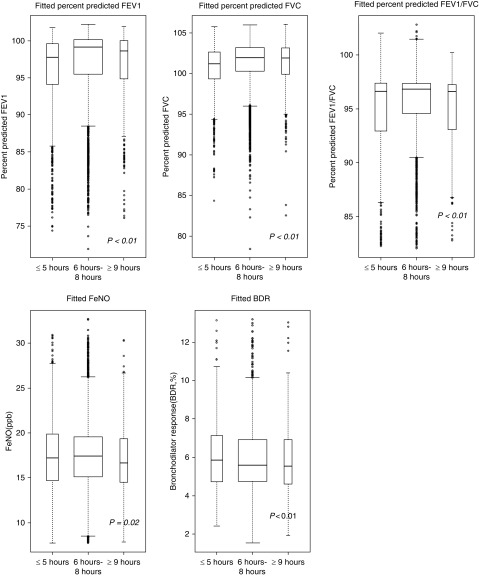
Figure 1.
Boxplot of model-fitted values of lung function measures against sleep duration categories (i.e., ≤5 h, 6–8 h, and ≥9 h). Linear regression was fitted for the analysis of lung function measures (FEV1% predicted, FVC% predicted, and % predicted FEV1/FVC), which was adjusted for annual household income, body mass index, current asthma status, smoking status, and use of oral or inhaled steroids in the past 2 days. The models for bronchodilator response (BDR) and fractional exhaled nitric oxide (FeNO) were additionally adjusted for age, sex, and race/ethnicity. P value is for the one-way ANOVA between the three groups. The widths of the boxes are proportional to the sample size in every group.

