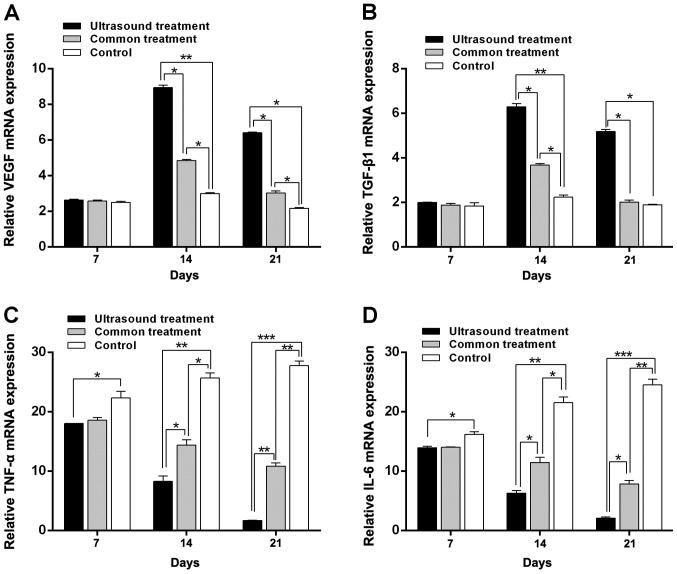
Figure 3.
Reverse transcription-quantitative PCR results of VEGF, TGF-β1, TNF-α and IL-6 in each group following treatment. The expression of (A) VEGF and (B) TGF-β1 in the US group was significantly increased on the 14th day and 21st day compared with the control. Furthermore, as treatment time prolonged, the expression of (C) TNF-α and (D) IL-6 were gradually reduced in the US group, with the expression being lowest on the 21st day. *P<0.05, **P<0.01 and ***P<0.001 as indicated. VEGF, vascular endothelial growth factor; TGF-β1, transforming growth factor-β1; TNF-α, tumor necrosis factor-α; IL-6, interleukin-6; US, ultrasound.

