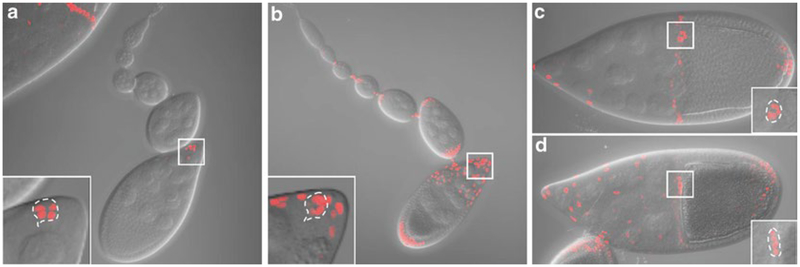
Fig. 2.
Expression patterns of slbo-Gal4 and c306-Gal4. Maximum intensity projection of z stacks showing fluorescence superimposed on DIC images for slbo-Gal4 (a and c) or c306-Gal4 (b and d) driving UAS-dsRednls expression. The germarium through early stage 9 is shown in (a) and (b). Stage 10 egg chambers are shown in (c) and (d). Inset shows the magnified view of the boxed area with maximum intensity projection of the cropped z stacks for the border cell cluster. The outline of the border cell cluster is shown by the dashed line

