Figure 4:

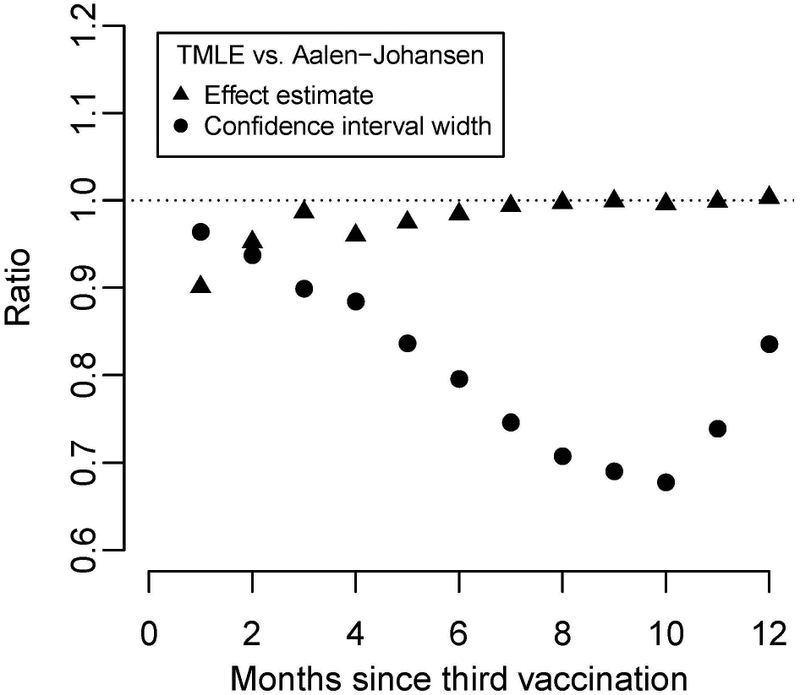
Relative sieve effect estimate (triangle) and confidence interval width (circle) from RTS,S/AS01 trial comparing TMLE to AJ. Values less than one indicate lower point estimate/variance for TMLE.

Relative sieve effect estimate (triangle) and confidence interval width (circle) from RTS,S/AS01 trial comparing TMLE to AJ. Values less than one indicate lower point estimate/variance for TMLE.