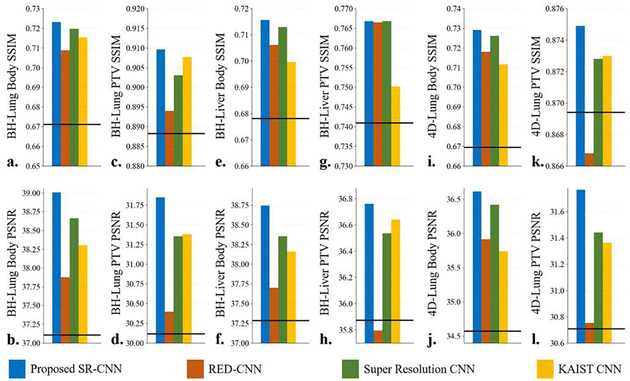
Fig. 5A.
Quantitative results of the study on reconstruction using projections simulated from real patient data with lung and liver tumor and from different institutions. (a-b) are the mean SSIM and PSNR within body region of the breath hold lung patients. (c-d) are the mean SSIM and PSNR within PTV of the breath hold lung patients. (e-f) are the mean SSIM and PSNR within body region of the breath hold liver patients. (g-h) are the mean SSIM and PSNR within PTV of the breath hold liver patients. (i-j) are the mean SSIM and PSNR within body region of the 4D Lung patients. (k-l) are the mean SSIM and PSNR within PTV of the 4D Lung patients. The horizontal line in each figure indicates the input TV image metric.

