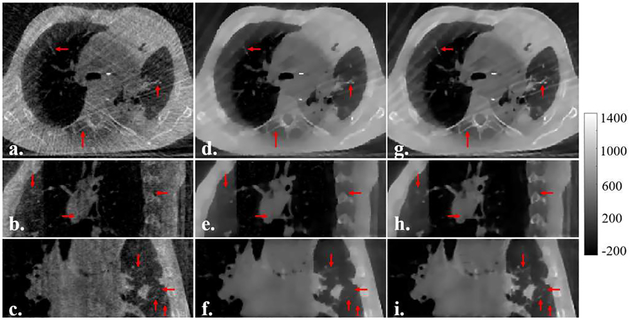
Fig. 6A.
Results of SR-CNNar in each column indicates the image displ are the referenced fully-sampled FDK images reconstructed from 224 projections. (d-f) are the under-sampled TV images reconstructed from 145 projections. (g-i) are the SR-CNN augmented images. Color bar on the right side indicates the image display window/level.

