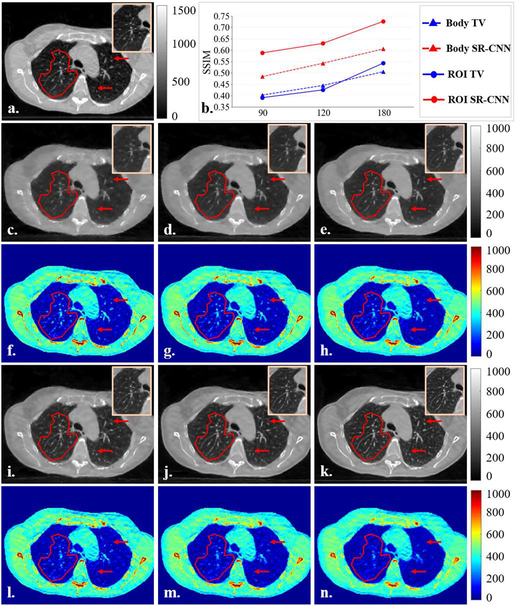
Fig. 6B.
Results of SR-CNN robustness study. A free-shape region of interest (ROI) is highlighted in transparent red mask to evaluate our proposed SR-CNNI) robustness against clinical projection number. (a) is ground truth CBCT image reconstructed from fully-sampled projections using a clinical CBCT constructor. (b) is the SSIM of selected ROI as function of projection number. (c-e) are TV based CBCT images reconstructed from 90, 120 and 180 projections, respectively. (f-h) are the corresponding difference images between (c-e) and the ground truth. (i-k) are corresponding SR-CNN augmented images. (l-n) are the corresponding difference images between (i-k) and the ground truth. ROIs are zoomed in and placed on the top corners of images. Red arrows indicate image details for visual inspection. Color bar in each column indicates the image display window/level.

