Abstract
Aim:
The prevalence of chronic kidney disease (CKD) in the elderly is controversial because age-related decline in kidney function may not truly reflect underlying kidney disease. We estimate the baseline prevalence and predictors of CKD using the CKD Epidemiology Collaboration (CKD-EPIeGFR) and Berlin Initiative Study 1 (BIS1eGFR) eGFR equations in the ASPirin in Reducing Events in the Elderly (ASPREE) trial cohort of healthy older participants.
Methods:
GFR was estimated using CKD-EPI and BIS1 equations. CKD was defined as eGFR <60 mL/min/1.73 m2 or > 60 mL/min/1.73 m2 with urine albumin creatinine ratio (UACR) > 3 mg/mmol. Logistic regression was used to identify predictors of CKD prevalence defined by each eGFR equation.
Results:
Data for analysis were complete for 17,762 participants. Mean age was 75.1 years (SD 5); 56.4% were female, 76.4% had hypertension, 9% had diabetes mellitus. Mean CKD-EPIeGFR was 73.0 (SD 14.2), compared with mean BIS1eGFR of 62.7 (11.4). Median UACR was 0.8 (IQR 0.5, 1.5) mg/mmol. Prevalence of CKD by CKD-EPIeGFR was 27% (predominantly due to normoalbuminuric stage 3a CKD), substantially lower than 47.1% by BIS1eGFR; the difference was predominantly driven by reclassification of individuals from G1 and G2 CKD to stage G3a without albuminuria. Increased prevalence of CKD by either equation was related to older age, hypertension, diabetes, or higher body mass index.
Conclusions:
Prevalence of CKD with CKD-EPIeGFR was 27%, and doubled using the elderly specific BIS1eGFR, with most participants reclassified from stage 2 to stage 3a. Increased prevalence of CKD was related older age, hypertension, diabetes, or increased body mass index.
Keywords: albuminuria, chronic kidney disease, elderly, estimated glomerular filtration rate, prevalence
Reliable estimates of the prevalence and predictors of chronic kidney disease (CKD) in the elderly in general, and in the ‘healthy’ elderly (i.e. those without overt cardiovascular disease (CVD)) in particular, are few.1 However, as age is included in the glomerular filtration rate (GFR) estimating equations and GFR declines with age, CKD is common in the elderly.2 Whether this age-related eGFR decline truly reflects intrinsic kidney disease, or rather, age-related damage from cardiometabolic comorbidity (such as hypertension, ischaemic heart disease, or diabetes), has led to robust debate on the applicability of the traditional definitions of CKD in the elderly.1,3,4 Understanding the relationship between reduced kidney function and aging is important, because reduced estimated GFR (eGFR) in the elderly is independently associated with increased all-cause and cardiovascular mortality.1,5
Some investigators have thus proposed alternative equations that may provide a more accurate estimate of kidney function in the elderly, such as the recent elderly specific Berlin Initiative Study Equation 1 (BIS1),6 which reportedly has less bias than the currently recommended Chronic Kidney Disease Epidemiology Collaboration (CKD-EPI) equation in which the development dataset comprised only 3% elderly subjects (age > 70 years).7 However, whether the BIS1 equation is superior to the CKD-EPI equation in the elderly remains debatable,8,9 as does the effect of using an elderly specific equation to ascertain CKD prevalence in older populations. Comparing prevalence of CKD in a healthy older cohort with previous estimates such as those from the National Health and Nutrition Examination Survey study10,11 could illuminate the potential variability of CKD prevalence between population cohorts, and the extent to which lack of CVD may influence this variability.
Clinical trials that enrol generally healthy elderly individuals provide an opportunity to further investigate this question. The ASPirin in Reducing Events in the Elderly (ASPREE) trial is a large (n > 19 000) double-blind, randomized, placebo-controlled trial designed to assess whether daily treatment with 100 mg of enteric-coated aspirin extends the duration of life free of dementia and physical disability.12 The trial was specifically designed to enrol relatively healthy participants, that is, those without diagnosed cardiac events, stroke, dementia, or persistent physical disability. As such, the ASPREE trial cohort provides an opportunity to assess prevalence of and risk factors for CKD in ostensibly healthy elderly individuals.
The aims of the present study were to determine prevalence of CKD in ASPREE participants, as defined by the 2012 Kidney Disease: Improving Global Outcomes (KDIGO) CKD staging criteria,2 using both CKD-EPI7 and BIS16 equations, to determine whether the BIS1 equation substantially reclassifies CKD relative to the CKD-EPI equation, and to compare these prevalence estimates with previous estimates in less healthy older populations. We also modelled factors associated with CKD in ASPREE participants upon study entry.
METHODS
Study design and population
This was a cross-sectional analysis of the ASPREE cohort at baseline, prior to randomization. The ASPREE trial is a placebo-controlled trial of low-dose aspirin designed to determine whether 5 years of daily 100 mg enteric-coated aspirin extends disability-free and dementia-free life in an apparently healthy elderly population. The study design and main results have been recently previously been published.12–15 Eligible participants were generally healthy individuals aged 70 years or older, except for US African American or Hispanic participants, who were eligible at age 65 years or older. Enrolment was permitted for individuals with hypertension or diabetes, if these conditions were well controlled. A more detailed description of the study is available in the Supporting Information. In the present analysis, we required participants to have had a baseline assessment of kidney function (serum creatinine and urine albumin creatinine ratio (UACR)). ASPREE was approved by multiple Institutional Review Boards in the United States and Australia, registered with International Standard Randomized Controlled Trial Number Register (ISRCTN83772183) and clinicaltrials.gov (NCT01038583) and undertaken in accordance with the Declaration of Helsinki.
Study variables
Participant demographic variables and health measures were assessed at baseline. Diabetes mellitus was defined by selfreport, fasting blood glucose ≥126 mg/dL, or treatment for diabetes. Hypertension was defined as the mean of three systolic blood pressure readings exceeding 160 mm/Hg or three diastolic blood pressure readings exceeding 90 mmHg, or by pharmacologic treatment for high blood pressure. Quality of life was measured using the SF-12 and reported as mental component score or physical component score.16
Study measures
Chronic kidney disease was defined using KDIGO criteria, namely eGFR <60 mL/min per 1.73 m2 (GFR categories G3a-G5) or UACR >3 mg/mmol with eGFR >60 mL/min per 1.73 m2. 2 CKD severity was classified according to the KDIGO CKD staging system using both the eGFR and UACR measures. We calculated eGFR based on serum creatinine using two separate estimating equations, namely the CKD-EPI (CKD-EPIeGFR) and BIS1 (BIS1eGFR).6,7 Laboratory measures and formulae for the two separate estimating equations are described in the Supporting Information.
Statistical analysis
All data are presented as number (percentage), mean ± 1 standard deviation (SD), or median (interquartile range) where appropriate. Prevalence of CKD stage 3 was tabulated by CKD risk factors of interest, including baseline demographics (age, sex, race, ethnicity, country of origin), comorbid conditions, and the physical function and quality-of-life scores. The distributions of CKD-EPIeGFR and BIS1eGFR are presented using kernel density plots which attempt to show the distribution of values in a similar way to a histogram. Comparisons and agreement between CKD-EPIeGFR and BIS1eGFR were performed using Bland-Altman analysis; additionally, agreement with regard to CKD severity staging was assessed. The CKD-EPIeGFR was considered the gold standard for these comparisons.
The association of variables potentially related to presence of CKD at baseline were examined using multivariable logistic regression. In addition, in participants free of CKD as defined by KIDGO (eGFR ≥60 mL/min per 1.73 m2 with no albuminuria) according to CKD-EPIeGFR, we compared the predictors for those who were and were not reclassified with CKD (eGFR <60 mL/min per 1.73 m2) by BIS1eGFR using multivariable logistic regression. We considered a finding to be statistically significant if the two-sided P value was less than 0.05. All analyses were conducted using Stata MP 14.1 (Statacorp, College Station, Texas, USA).
RESULTS
Study population
A total of 19 114 participants gave informed consent and were randomized to receive aspirin or placebo in the ASPREE trial (Fig. 1). Of these, seven participants who required maintenance dialysis or kidney transplant were excluded. A further 1345 participants with missing eGFR or UACR readings at baseline were excluded, leaving 17 762 participants for analysis.
Fig. 1.
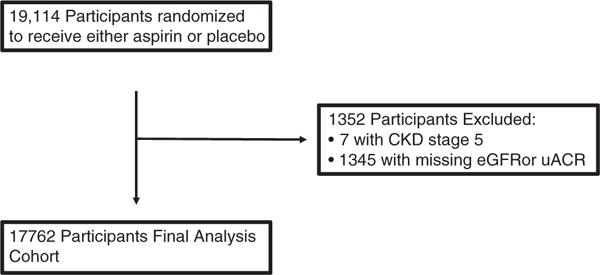
Participant flow diagram. CKD, chronic kidney disease; eGFR, estimated glomerular filtration rate; UACR, urine albumin-to-creatinine ratio.
CKD prevalence and severity by CKD equation
Baseline characteristics of the participants, classified according to CKD status by CKD-EPIgGFR, are detailed in Table 1. Mean age was 75.1 ± 4.6 years; 56.4% were female, 74.4% had hypertension, and 10.8% self-reported diabetes mellitus. At baseline, 4758 participants (26.7%) were classified as having CKD based on CKD-EPIeGFR, compared with 8253 (46.5%) based on BIS1eGFR. Participants with CKD by CKD-EPIeGFR were older (mean age 76.6 ± 5.2 years, vs 74.6 ± 4.3 years for those without CKD), and prevalence of hypertension (83.1% vs 71.1%) and diabetes (15.2% vs 9.2%) was higher. Proportions of women, years of education and cigarette smoking were similar between the two groups. Mean body mass index, total cholesterol and triglyceride levels were higher in participants with CKD. Those with CKD had lower physical component SF-12 t-scores (46.6 ± 9.2 vs 48.9 ± 8.5) but similar mental component t-scores (55.8 ± 7.2 vs 55.7 ± 7.1). Baseline characteristics of the participants classified according to CKD status by BIS1eGFR are shown in Table S1. In general, the patterns described above for CKD-EPIeGFR were preserved, despite the higher baseline prevalence of CKD by BIS1eGFR.
Table 1.
CKD status by the CKD-EPI equation
| CKD Status (CKD-EPI equation) |
||||
|---|---|---|---|---|
| No CKD |
CKD |
Total |
||
| n = 13 004 (73%) | n = 4758 (27%) | n = 17 762 | P | |
| Age at randomization, years, mean (SD) | 74.6 (4.2) | 76.6 (5.2) | 75.1 (4.6) | <0.001 |
| Age group, years, n (%) | <0.001 | |||
| 65–69 | 427 (3) | 121 (3) | 548 (3) | |
| 70–74 | 7716 (59) | 2084 (44) | 9800 (55) | |
| 75–79 | 3376 (26) | 1312 (28) | 4688 (26) | |
| 80–84 | 1163 (9) | 887 (19) | 2050 (12) | |
| >85 | 322 (2) | 354 (7) | 676 (4) | |
| Country, n (%) | 0.008 | |||
| Australia | 11 347 (87) | 4079 (86) | 15 426 (87) | |
| United States | 1657 (13) | 679 (14) | 2336 (13) | |
| Female, n (%) | 7325 (56) | 2700 (57) | 10 025 (56) | 0.62 |
| Living situation, n (%) | <0.001 | |||
| Home alone | 4075 (31) | 1737 (37) | 5812 (33) | |
| Home with family, friends, spouse | 8880 (68) | 2990 (63) | 11 870 (67) | |
| Residential home | 49 (0) | 31 (1) | 80 (0) | |
| Years of education, n (%) | <0.001 | |||
| <9 | 1934 (15) | 859 (18) | 2793 (16) | |
| 9–11 | 3788 (29) | 1401 (29) | 5189 (29) | |
| 12 | 1543 (12) | 609 (13) | 2152 (12) | |
| 13–15 | 2243 (17) | 802 (17) | 3045 (17) | |
| 16 | 1238 (10) | 402 (8) | 1640 (9) | |
| 17–21 | 2258 (17) | 685 (14) | 2943 (17) | |
| Family history of kidney disease, n (%) | 882 (7) | 362 (8) | 1244 (7) | 0.056 |
| Diabetes mellitus, n (%) | 1202 (9) | 725 (15) | 1927 (11) | <0.001 |
| Hypertension, n (%) | 9244 (71) | 3954 (83) | 13 198 (74) | <0.001 |
| Smoking, n (%) | 0.61 | |||
| Current | 497 (4) | 195 (4) | 692 (4) | |
| Former | 5317 (41) | 1961 (41) | 7278 (41) | |
| Never | 7190 (55) | 2602 (55) | 9792 (55) | |
| Alcohol use, n (%) | <0.001 | |||
| Current | 10 139 (78) | 3461 (73) | 13 600 (77) | |
| Former | 746 (6) | 324 (7) | 1070 (6) | |
| Never | 2119 (16) | 973 (20) | 3092 (17) | |
| Systolic BP, mean (SD) | 138.6 (16.3) | 141.0 (16.9) | 139.2 (16.5) | <0.001 |
| Diastolic BP, mean (SD) | 77.4(9.8) | 77.1 (10.4) | 77.3 (10.0) | 0.071 |
| ACE/ARB | 2268 (22) | 2490 (33) | 4758 (27) | <0.001 |
| Total cholesterol, mg/DL, mean (SD) | 203.8 (37.5) | 199.5 (39.5) | 202.7 (38.1) | <0.001 |
| Triglyceride, mg/DL, mean (SD) | 113.8 (56.0) | 127.4 (64.1) | 117.4 (58.6) | <0.001 |
| Height, m, mean (SD) | 1.66 (0.09) | 1.65 (0.09) | 1.65 (0.09) | 0.001 |
| Weight, kg, mean (SD) | 76.6 (14.6) | 77.8 (15.9) | 77.0 (15.0) | <0.001 |
| Body mass index, kg/m2, mean (SD) | 27.9 (4.6) | 28.5 (5.0) | 28.1 (4.7) | <0.001 |
| eGFR (CKD-EPI), mL/min perm2 mean (SD) | 78.0 (10.1) | 59.3 (14.8) | 73.0 (14.2) | <0.001 |
| UACR (mg/mmol), median (IQR) | 0.7 (0.4, 1.1) | 1.8 (0.6, 4.8) | 0.8 (0.5, 1.5) | <0.001 |
| Physical component t-score, mean (SD) | 48.9 (8.5) | 46.9 (9.2) | 48.4 (8.7) | <0.001 |
| Mental component t-score, mean (SD) | 55.7 (7.1) | 55.7 (7.2) | 55.7 (7.1) | 0.84 |
ACE/ARB, angiotensin converting enzyme inhibitor, angiotensin receptor blocker or aldosterone antagonist use; BP, blood pressure; CKD, chronic kidney disease; CKD-EPI, Chronic Kidney Disease Epidemiology Collaboration; eGFR, estimated glomerular filtration rate; IQR, interquartile range; SD, standard deviation; UACR, urine albumin-to-creatinine ratio.
The distribution of eGFR values by both equations is shown in Fig. 2, with BIS1eGFR shifted towards lower values compared with CKD-EPIeGFR. Mean CKD-EPIeGFR was 73.0 mL/min per 1.73 m2 (SD 14.2), compared with mean BIS1eGFR of 62.7 (11.4). The shift to lower values was evident when assessed in subgroups according to presence or absence of diabetes and hypertension (Figures S1a and b, respectively). The level of agreement between equations is shown in Fig. 3, which demonstrates that at lower eGFR values (more severely impaired kidney function), agreement between the two equations was good. However, as average eGFR values increased, BIS1eGFR values were lower than CKD-EPIeGFR values. This relationship appeared more pronounced as age increased.
Fig. 2.
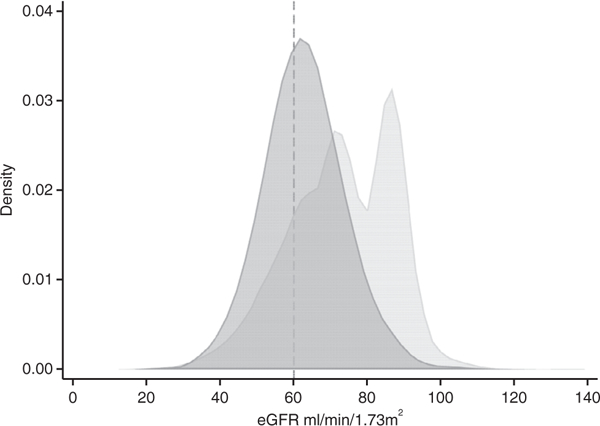
Kernel density plot demonstrating the distribution of eGFR by CKD-EPI and BIS1 equations. BIS1, Berlin Initiative Study; CKD-EPI, Chronic Kidney Disease Epidemiology Collaboration; eGFR, estimated glomerular filtration rate. ( ) CKD-EPI and (
 ) BIS1.
Fig. 3.
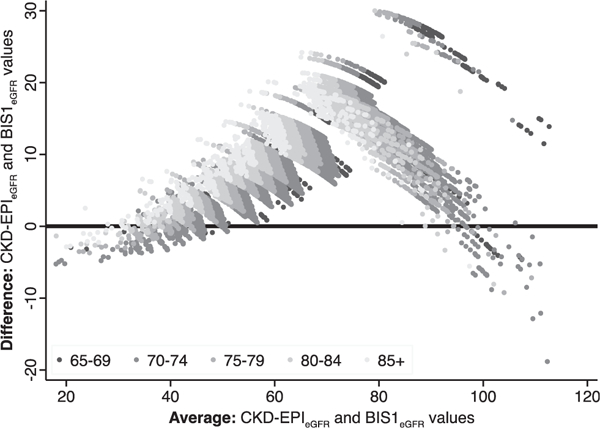
Bland Altman plot of eGFR to demonstrate extent of agreement between CKD-EPI and BIS1 equations. BIS1, Berlin Initiative Study; CKD-EPI, Chronic Kidney Disease Epidemiology Collaboration; eGFR, estimated glomerular filtration rate.
The distribution of KDIGO CKD stage for the CKD-EPIeGFR and BIS1eGFR are shown in Fig. 4a. Using CKD-EPIeGFR (Fig. 4a, left panel), 72.6% of the cohort had normal (G1, 7.5%) or mildly decreased (G2, 65.7%) eGFR with no albuminuria (A1), 12.9% had mild to moderately decreased eGFR with no albuminuria (G3a-A1), and 7.1% had mildly decreased eGFR with microalbuminuria (G2-A2). The corresponding right panel displays the same data by BIS1eGFR. Just over half of the cohort (52.4%) had mildly decreased eGFR with no albuminuria (G2-A1), and 31.0% had mild to moderately decreased eGFR with no albuminuria (G3a-A1). In participants with mild albuminuria, 5.3% had mildly decreased (G2-A2) eGFR and 4.1% mild to moderately decreased (G3a-A2) eGFR. Prevalence of microalbuminuria (UACR >3 mg/mL), irrespective of GFR stage, was low at 0.8%.
Fig. 4.
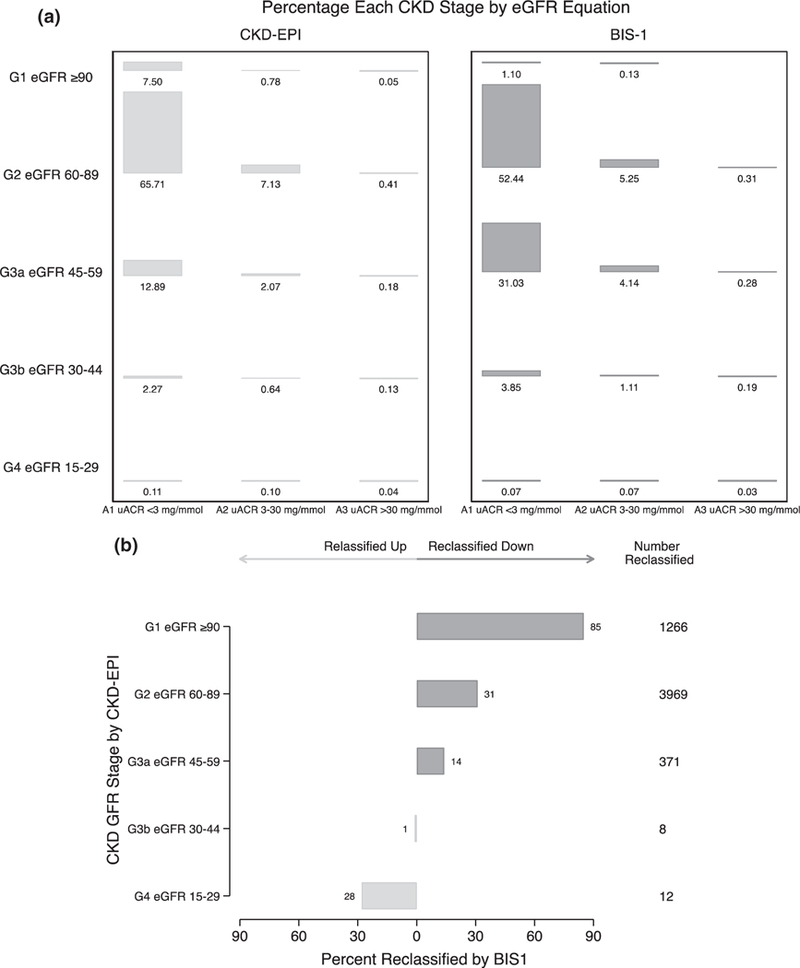
(a) KDIGO CKD stage classification for the ASPREE cohort participants by CKD-EPIeGFR (left panel) and BIS1 (right panel). (b) Percentage of participants in each CKD-EPI CKD stage reclassified to a new stage by BIS1eGFR. Reclassified down corresponds to reclassification to a higher (i.e. more severe) CKD G stage, for example from stage G1 to G2. Reclassified up corresponds to reclassification to a lower (i.e. less severe) CKD G stage, for example from stage G4 to G3b. BIS1, Berlin Initiative Study; CKD-EPI, Chronic Kidney Disease Epidemiology Collaboration; eGFR, estimated glomerular filtration rate; UACR, urine albumin-to-creatinine ratio.
Reclassification across CKD G stages using BIS1eGFR in lieu of CKD-EPIeGFR is shown in Fig. 4b. Among participants with stage G1 by CKD-EPIeGFR, 85.2% were reclassified to stage G2, 30.5% with stage G2 (CKD-EPIeGFR) to stage G3a (BIS1eGFR) and 13.8% with stage 3a (CKD-EPIeGFR) to stage G3b (BIS1eGFR). Eight participants (1.5%) with stage G3b by CKD-EPIeGFR were reclassified to stage G3a, and 28.0% of those with stage G4 CKD (CKD-EPIeGFR) were reclassified to stage G3b by BIS1eGFR.
Because the most pronounced effect of switching from CKD-EPIeGFR to BIS1eGFR appeared to be reclassification from stages G1 and G2 to G3a in participants with no albuminuria (stage A1), factors associated with this switch were examined and are presented in Fig. 5. Adjusted for other factors, the strongest association was due to age: compared with participants aged 65–69 years, the adjusted odds ratios (AOR) for reclassification were 5.18 (95% confidence interval (CI) = 3.80–7.04) for those aged 75–79 years and 23.42 (95% CI = 15.85–34.61) for those aged ≥85 years. While participants with hypertension were also more likely to be reclassified to higher CKD stages using BIS1eGFR (AOR = 1.26; 95% CI = 1.14–1.38), those with diabetes were not. Women were less likely to be reclassified than men (AOR = 0.87; 95% CI = 0.80–0.96).
Fig. 5.
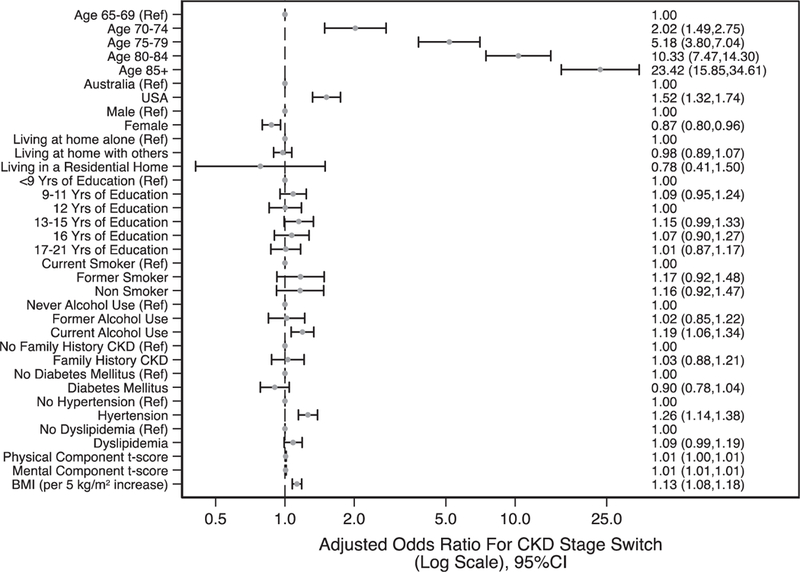
Factors associated with reclassification to CKD 3a by BIS1eGFR from stage 1 and 2 by CKD-EPIeGFR. BIS1, Berlin Initiative Study; BMI, body mass index; CKD, chronic kidney disease; CKD-EPI, Chronic Kidney Disease Epidemiology Collaboration; eGFR, estimated glomerular filtration rate.
Predictors of CKD
Factors associated with CKD at baseline, defined by both equations, are shown in Fig. 6a and b. The strongest association with increased likelihood of CKD using CKD-EPIeGFR was for age: AOR for CKD at baseline were 1.99 (95% CI = 1.57–2.52) for participants aged 75–79 years and 5.41 (95% CI = 4.09–7.15) for participants aged >85 years, compared with those aged 65–69 years. Other demographic and health factors associated with increased likelihood of CKD included US as country of residence (AOR = 1.30; 95% CI = 1.15–1.46), current alcohol use (AOR = 1.22; 95% CI = 1.11–1.34), diabetes (AOR = 1.49; 95% CI = 1.34–1.66), hypertension (AOR = 1.73; 95% CI = 1.59–1.89), dyslipidaemia (AOR = 1.14; 95% CI = 1.06–1.23), and higher body mass index (AOR = 1.08 per 5 kg/m2 (95% CI = 1.04–1.12). Female sex (AOR = 0.91; 95% CI = 0.85–0.99), non-smoking (AOR = 0.83; 95% CI = 0.850.99), longer duration of education, and increasing SF-12 physical t-score were associated with reduced likelihood of CKD. Patterns were generally similar using BIS1eGFR, but the effect of age was more pronounced; for example, AOR were 3.80 (95% CI = 3.07–4.71) for participants aged 75–79 years and 19.85 (95% CI = 14.68–26.85) for participants aged ≥85 years.
Fig. 6.
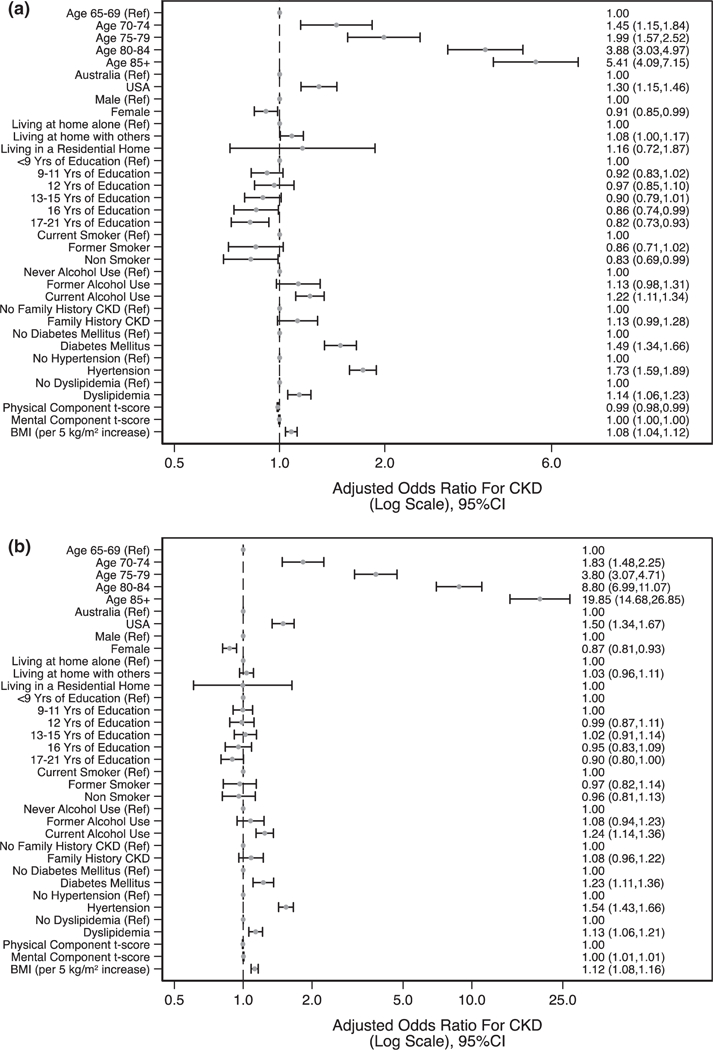
Relationships with CKD prevalence based on CKD-EPIeGFR (a) and BIS1eGFR (b) using logistic regression. BIS1, Berlin Initiative Study; BMI, body mass index; CKD, chronic kidney disease; CKD-EPI, Chronic Kidney Disease Epidemiology Collaboration; eGFR, estimated glomerular filtration rate.
DISCUSSION
Using a large, generally healthy elderly cohort, we examined prevalence of and factors associated with baseline CKD and determined that the elderly specific BIS1 equation gives differential lower distribution of eGFR values compared with the CKD-EPI equation. Given the considerable debate about the diagnosis and prevalence of CKD in the elderly, we reasoned that the ASPREE cohort, the largest trial-based cohort of comparatively healthy individuals assembled to date, could provide insights into the classification of CKD stages in the healthy elderly.
The main findings from this study are three-fold. First, using the current guideline-recommended CKD-EPIeGFR equation,2 we found that while nearly three-quarters of healthy elderly participants were classified as having normal or mildly reduced kidney function without evidence of kidney damage (stage G1–2-A1), more than one-quarter were classified as having CKD (stage G3a or higher). Second, using BIS1eGFR in this population, the distribution of eGFR measurements was shifted toward lower eGFR values, resulting in CKD prevalence of nearly 50%. This increase in prevalence was primarily driven by reclassification of participants with stage G2-A1 CKD to stage G3a-A1. While reclassified participants were more likely than those not reclassified to have hypertension, the strongest predictor of reclassification by BIS1eGFR was increasing age. Third, while factors associated with CKD were generally similar using both equations, and consisted, as one might expect, of traditional CKD risk factors (e.g. increasing age, hypertension, dyslipidaemia, diabetes mellitus) the relationship with increasing age was considerably stronger with BIS1eGFR than with CKD-EPIeGFR; this was also true for female sex, albeit in the opposite direction (women less likely to have CKD).
The CKD prevalence of 26.7% in participants aged 70 years or older is lower than seen in some but not all previous studies using CKD-EPIeGFR. For example, CKD prevalence was 47% in a 1999–2004 National Health and Nutrition Examination Survey cohort10 and 35.4% in the elderly subgroup of Trieste Registry of Cardiovascular Diseases.17 In the Berlin Initiative Study (also a study of a healthy community-based elderly individuals), CKD prevalence, at 30.2%,6 was also similar to ours, despite a higher prevalence of both diabetes mellitus (24% vs 11% in ASPREE) and myocardial infarction (15% vs 0% in ASPREE, Table S2) in the BIS cohort.
Whether reduced kidney function in the elderly is a natural part of aging, or is the result of major co-occurring diseases commonly encountered in industrialized countries has long been a topic of robust discussion.1,3,4 This question has broad public health implications, because ‘automatic’ classification of individuals with CKD based on an eGFR threshold in the absence of urinary abnormalities or signs of kidney disease would likely lead to over-diagnosis of CKD in the elderly. Examination of relatively healthy elderly individuals, ostensibly free of diagnosed CVD or poorly controlled hypertension or diabetes, provided an unprecedented opportunity to study this issue, especially when coupled with use of a novel equation specifically developed and validated in the elderly. Using CKD-EPIeGFR, approximately 1 in 8 individuals had G3a disease even in the absence of albuminuria. However, BIS1eGFR results suggested that even more elderly individuals have CKD than is commonly appreciated; nearly 1 in 3 participants were classified as having G3a disease in the absence of albuminuria. The primary reason appears to be the role that the age coefficient plays in the BIS1eGFR equation, a finding supported by our models demonstrating that increasing age was the factor most strongly associated with the odds of CKD reclassification (using BIS1eGFR in lieu of CKD-EPIeGFR) and presence of CKD at baseline. If the rationale behind development of the BIS1 equation is correct, and its validation is reproducible (as in a recent systematic review8), it suggests a very strong component of aging per se that contributes to reduced eGFR. In the apparent absence of concomitant disease, the implication is that ‘natural’ aging results in a more substantial decrease in eGFR than is commonly appreciated. As this analysis is cross-sectional in nature, it cannot conclusively determine whether aging per se is the major determinant of reduced GFR. Even in ostensibly otherwise healthy individuals, other factors, such as the duration and severity of hypertension, are not fully characterized in the ASPREE cohort and could have provided a major contribution to the findings seen here.
However, the potential public health implications of these findings must be carefully considered, because the implications of increased classification of CKD in the elderly would likely lead to inappropriate (over)use of serial monitoring for CKD progression, nephrology consultation, and perhaps increased diagnostic evaluation that would be unlikely to benefit patients. Given the considerable emphasis directed toward recognition of CKD in the general population (such as by the widespread introduction of automated eGFR values in clinical laboratory settings), use of BIS1eGFR would likely lead to the diagnosis of CKD 3a in many more individuals worldwide. An apparent resulting paradox is that use of BISI as an elderly-specific equation, may lead to overdiagnosis of CKD, a situation already highlighted as a major problem with the current CKD staging system.1 Whether or not this is appropriate would likely be answered only by determining whether BIS1eGFR identifies stronger associations with outcomes such as end-stage kidney disease (ESKD), death, or cardiovascular morbidity than CKD-EPIeGFR (a recent study by Tarantini et al. suggest that this may in fact be the case17). Additional potential benefits of alerting healthcare providers to the ‘occult’ presence of significant CKD could stem from ensuring the safer use of medicines in the elderly and/or identification of patients at increased risk of acute kidney injury.
Also notable, a substantial percentage of individuals with advanced CKD (i.e. stage G4 disease) identified by CKD-EPIeGFR were actually reclassified to categories of higher kidney function with BIS1eGFR. This suggests that the BIS1 equation serves to ‘collapse’ the extremes of kidney function in the elderly relative to CKD-EPIeGFR. Although the number of individuals affected by upward reclassification (lower stage, increase kidney function) is small (given that advanced CKD was rare, in absolute terms, in the ASPREE cohort), BIS1eGFR might serve a public health benefit in reducing the likelihood that elderly individuals are considered by their health-care providers to be at risk of advancing to ESKD on the basis of eGFR alone.
This study has important strengths. First, participants comprised a large healthy elderly cohort and were well-characterized at baseline upon enrolment into the ASPREE clinical trial. Examination of such a cohort enables analysis of the effect of an eGFR assessment in individuals whom population-based screening would largely target. The principle limitation of this, and indeed the majority of other studies of the burden of CKD, is a reliance on isolated crosssectional measurements of serum creatinine and UACR to diagnose CKD. In clinical practice, diagnosis requires a decreased GFR persistent for 3 or more months, thus, potentially leading to some degree of overestimation of the prevalence of CKD.
In conclusion, CKD is common and increases with age even in healthy elderly people. The elderly specific BIS1eGFR substantially increases CKD prevalence, largely by reclassifying participants to stage 3a CKD, the strongest factor associated with reclassification being increasing age itself. This is the case regardless of which equation is used. These findings have broad public health implications for the classification of CKD in the elderly because any equation that results in lower estimates of GFR may result in possibly unwarranted increased medical scrutiny. The clinical implications of the aging kidney and the question of how competing eGFR equations are associated with outcomes such as ESKD or death should continue to be studied.
Supplementary Material
Table S1. CKD Status by the BIS1 Equation
Table S2. Comparison between ASPREE, Berlin Initiative Study and Chronic Kidney Disease Epidemiology Collaboration (CKD-EPI) Derivation Cohorts.
Figure S1. Kernel density plots demonstrating the distribution of eGFR by CKD-EPI and BIS1 equations according to presence or absence of (panel A) diabetes and (panel B) hypertension. BIS1, Berlin Initiative Study; CKD-EPI, Chronic Kidney Disease Epidemiology Collaboration; eGFR, estimated glomerular filtration rate.
SUMMARY AT A GLANCE.
Chronic kidney disease (CKD) is common and increases with age even in healthy elderly people. The elderly specific Berlin Initiative Study 1 (BISIeGFR) estimated glomerular filtration rate (eGFR) equation BISIeGFR substantially increases CKD prevalence, largely by reclassifying elderly participants from G1 and G2 CKD to stage G3a without albuminuria to stage 3a CKD.
ACKNOWLEDGEMENTS
The work was supported by the National Institute on Aging and the National Cancer Institute at the National Institutes of Health (grant number U01AG029824); the National Health and Medical Research Council of Australia (grant numbers 334 047, 1 127 060); Monash University (Australia); and the Victorian Cancer Agency (Australia). The authors thank Nan Booth, MSW, MPH, ELS, of the Chronic Disease Research Group, for manuscript editing.
Footnotes
DISCLOSURE
We have no conflict of interest to report.
SUPPORTING INFORMATION
Additional supporting information may be found in the online version of this article at the publisher’s website:
REFERENCESs
- 1.Glassock R, Delanaye P, El-Nahas M. An age-calibrated classification of chronic kidney disease. JAMA 2015; 314: 559–60. [DOI] [PubMed] [Google Scholar]
- 2.KDIGO. KDIGO 2012 clinical practice guideline for the evaluation and Management of Chronic Kidney Disease. Kidney Int. Suppl 2012; 3: 1–150. [DOI] [PubMed] [Google Scholar]
- 3.Levey AS, Inker LA, Coresh J. Chronic kidney disease in older people. JAMA 2015; 314: 557–8. [DOI] [PubMed] [Google Scholar]
- 4.Kremers WK, Denic A, Lieske JC et al. Distinguishing age-related from disease-related glomerulosclerosis on kidney biopsy: The aging kidney anatomy study. Nephrol. Dial. Transplant 2015; 30: 2034–9. [DOI] [PMC free article] [PubMed] [Google Scholar]
- 5.Hallan SI, Matsushita K, Sang Y et al. Age and association of kidney measures with mortality and end-stage renal disease. JAMA 2012; 22: 1–12. [DOI] [PMC free article] [PubMed] [Google Scholar]
- 6.Schaeffner ES, Ebert N, Delanaye P et al. Two novel equations to estimate kidney function in persons aged 70 years or older. Ann. Intern. Med. 2012; 157: 471–81. [DOI] [PubMed] [Google Scholar]
- 7.Levey AS, Stevens LA, Schmid CH et al. A new equation to estimate glomerular filtration rate. Ann. Intern. Med 2009; 150: 604–12. [DOI] [PMC free article] [PubMed] [Google Scholar]
- 8.Oscanoa TJ, Amado JP, Romero-Ortuno R, Hidalgo JA. Estimation of the glomerular filtration rate in older individuals with serum creatinine-based equations: A systematic comparison between CKD-EPI and BIS1. Arch. Gerontol. Geriatr 2018; 75: 139–45. [DOI] [PubMed] [Google Scholar]
- 9.Fan L, Levey AS, Gudnason V et al. Comparing GFR estimating equations using cystatin C and creatinine in elderly individuals. J. Am. Soc. Nephrol 2015; 26: 1982–9. [DOI] [PMC free article] [PubMed] [Google Scholar]
- 10.Stevens LA, Viswanathan G, Weiner DE. Chronic kidney disease and end-stage renal disease in the elderly population: Current prevalence, future projections, and clinical significance. Adv. Chronic Kidney Dis 2010; 17: 293–301. [DOI] [PMC free article] [PubMed] [Google Scholar]
- 11.Murphy D, McCulloch CE, Lin F et al. Trends in prevalence of chronic kidney disease in the United States. Ann. Intern. Med 2016; 165: 473–17. [DOI] [PMC free article] [PubMed] [Google Scholar]
- 12.ASPREE Investigator Group. Study design of ASPirin in reducing events in the elderly (ASPREE): A randomized, controlled trial. Contemp. Clin. Trials 2013; 36: 555–64. [DOI] [PMC free article] [PubMed] [Google Scholar]
- 13.McNeil JJ, Nelson MR, Woods RL et al. Effect of aspirin on all-cause mortality in the healthy elderly. N. Engl. J. Med 2018; 379: 1519–28. [DOI] [PMC free article] [PubMed] [Google Scholar]
- 14.McNeil JJ, Wolfe R, Woods RL et al. Effect of aspirin on cardiovascular events and bleeding in the healthy elderly. N. Engl. J. Med 2018; 379: 1509–18. [DOI] [PMC free article] [PubMed] [Google Scholar]
- 15.McNeil JJ, Woods RL, Nelson MR et al. Effect of aspirin on disability-free survival in the healthy elderly. N. Engl. J. Med 2018; 379: 1499–508. [DOI] [PMC free article] [PubMed] [Google Scholar]
- 16.Ware J, Kosinski M, Keller SD. A 12-item short-form health survey: Construction of scales and preliminary tests of reliability and validity. Med. Care 1996; 34: 220–33. [DOI] [PubMed] [Google Scholar]
- 17.Tarantini L, McAlister FA, Barbati G et al. Chronic kidney disease and prognosis in elderly patients with cardiovascular disease: Comparison between CKD-EPI and Berlin initiative Study-1 formulas. Eur. J. Prev. Cardiol 2016; 23: 1504–13. [DOI] [PubMed] [Google Scholar]
Associated Data
This section collects any data citations, data availability statements, or supplementary materials included in this article.
Supplementary Materials
Table S1. CKD Status by the BIS1 Equation
Table S2. Comparison between ASPREE, Berlin Initiative Study and Chronic Kidney Disease Epidemiology Collaboration (CKD-EPI) Derivation Cohorts.
Figure S1. Kernel density plots demonstrating the distribution of eGFR by CKD-EPI and BIS1 equations according to presence or absence of (panel A) diabetes and (panel B) hypertension. BIS1, Berlin Initiative Study; CKD-EPI, Chronic Kidney Disease Epidemiology Collaboration; eGFR, estimated glomerular filtration rate.


