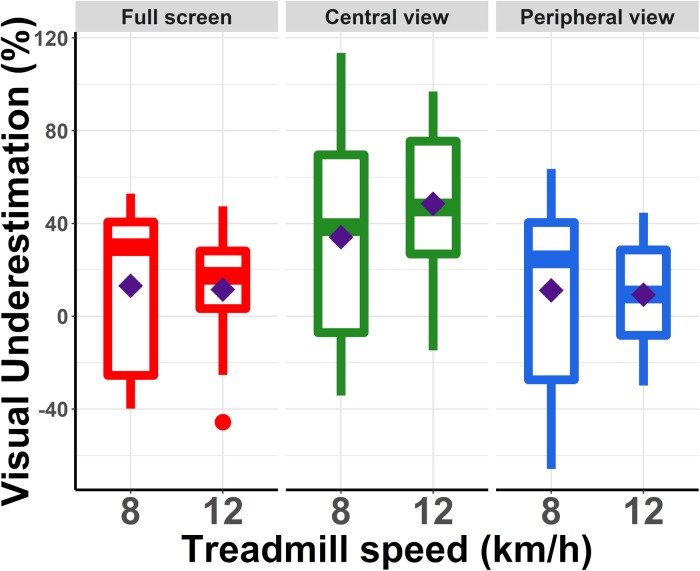
FIGURE 3.
Percentage of underestimation of visual speed relative to running speed. These values were computed using the equation: ln (perceived visual speed/actual running speed) ∗ 100. Each box summarized for each running speed and each condition the distribution of the responses of the participants. The diamond corresponds to the mean value. The central line corresponds to the median, with the box defining the inter-quartile range (IQR) between the first and the third quartile and the whiskers corresponding to ± 1.5IQR.

