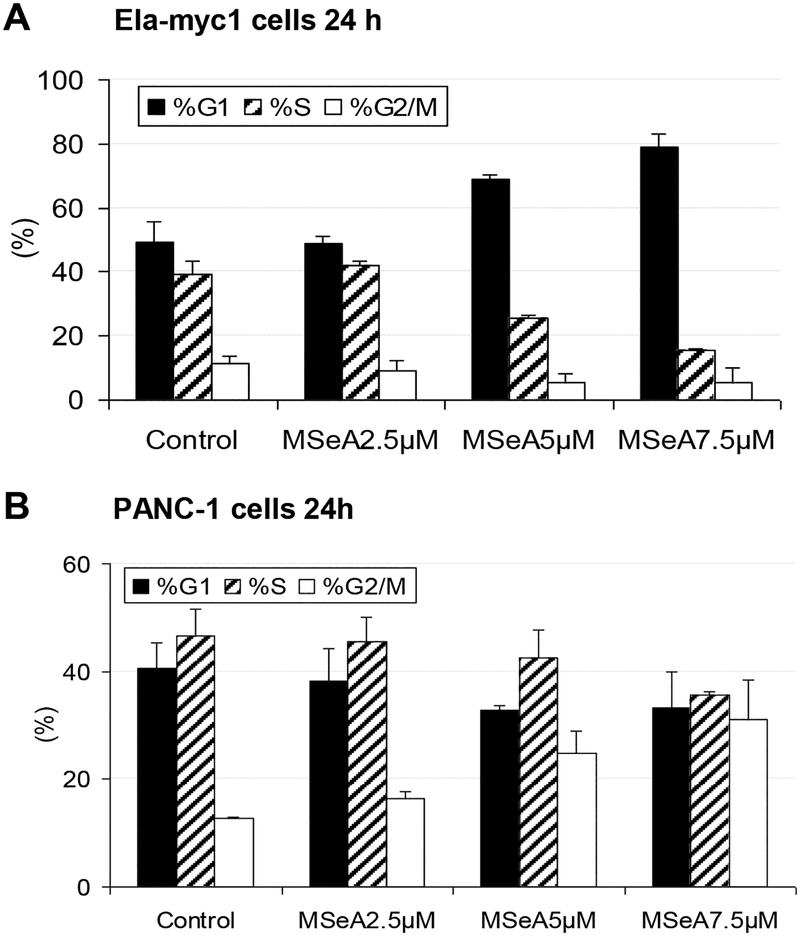
Figure 2. MSeA arrested pancreatic cancer cells in different phases of cell cycle.
Cell cycle distribution analyzed by propidium iodide staining and flowcytometry. A. Enrichment of G0/1 arrested mouse Ela-myc1 cells after 24 h MSeA treatment. B. Enrichment of “G2/M”- phase PANC-1 cells after 24 h MSeA treatment.

