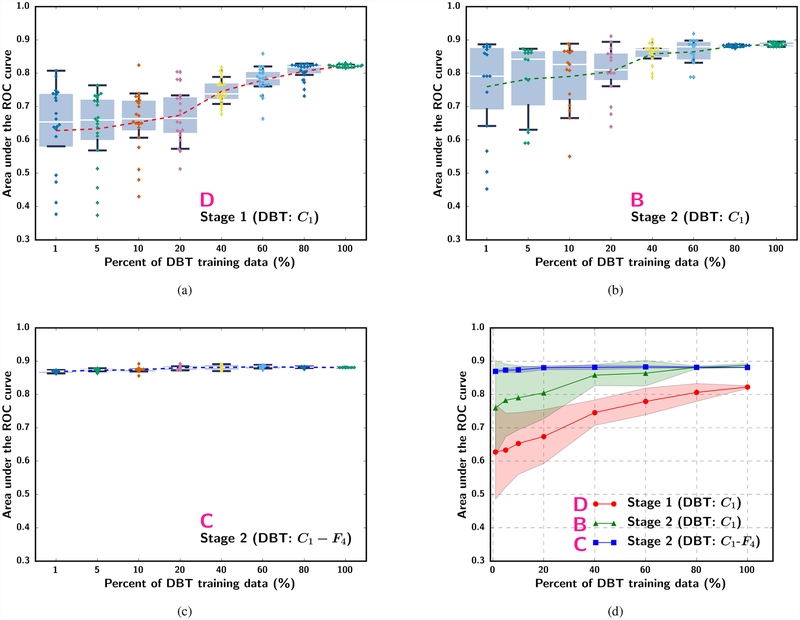
Fig. 6.
Box-and-whisker plots of the ROI-based AUC performance on the DBT test set while varying the simulated DBT sample size available for training. (a) single-stage transfer learning by DBT trained C1-frozen CNN without pre-training with mammography data (scheme D), (b) Stage 2 C1-frozen transfer learning using DBT training set after Stage 1 transfer learning with a fixed mammography data set (100%) (scheme B), and (c) Stage 2 C1-to-F4-frozen transfer learning using DBT training set after Stage 1 transfer learning with a fixed mammography data set (100%) (scheme C). The dotted line in (a) and (b) plots the mean AUC at each simulated training set size. Note that the plots in (a) to (c) use categorical x-axis to show details of the low percentage region. (d) shows the mean and standard deviation of AUC in (a) and (b) together with the x-axis plotted in a linear scale.

