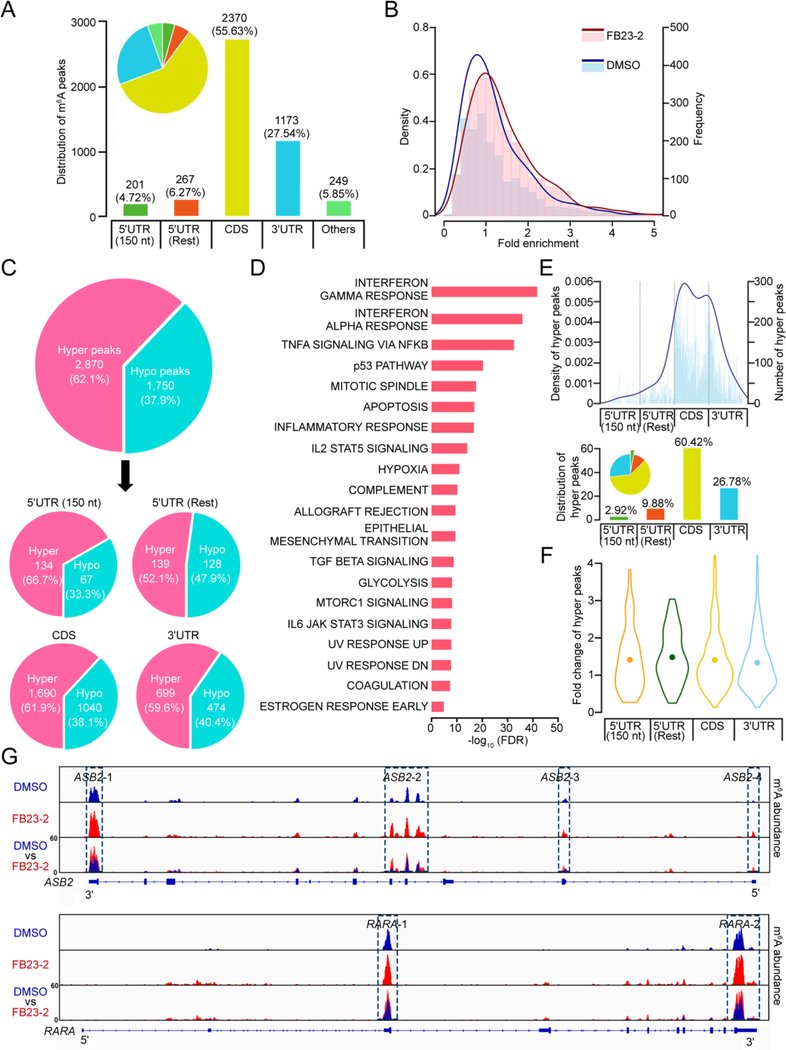
Figure 6. Transcriptome-wide m6A-seq assays to confirm the effects of FB23-2 in AML cells.
(A) Distribution of m6A peaks in different regions of mRNA as detected in m6A-seq assays conducted on MONOMAC6 cells upon treatment with DMSO or 5 μM FB23-2 for 72 hr. 5’UTR (150 nt) represents the first 150 nt of 5’ end of 5’UTR, while 5’UTR (Rest) represents the remaining regions of 5’ end of 5’UTR.
(B) The density (line) and frequency (histogram) of m6A peaks from m6A-seq assays conducted in FB23-2 treated (red) and DMSO treated (blue) MONOMAC6 cells.
(C) Distribution of FB23-2-increased m6A peaks (termed hyper peaks) and FB23-2-decreased m6A peaks (termed hypo peaks) from m6A-seq assays conducted in FB23-2 and DMSO treated MONOMAC6 cells. The peaks which were significantly (p < 0.001) altered in FB23-2 group compared with DMSO group are presented.
(D) GSEA analysis of the genes with increased m6A abundance upon FB23-2 treatment identified by m6A-seq in MONOMAC6 cells.
(E) The adjusted density (line, top) and distribution (histogram, bottom) of hyper peaks from (C) across different mRNA regions.
(F) Fold changes of hyper peaks from (C) in different regions of mRNAs.
(G) The m6A abundance in ASB2 and RARA transcripts. The m6A peaks were called by exomePeak.
See also Figure S4.

