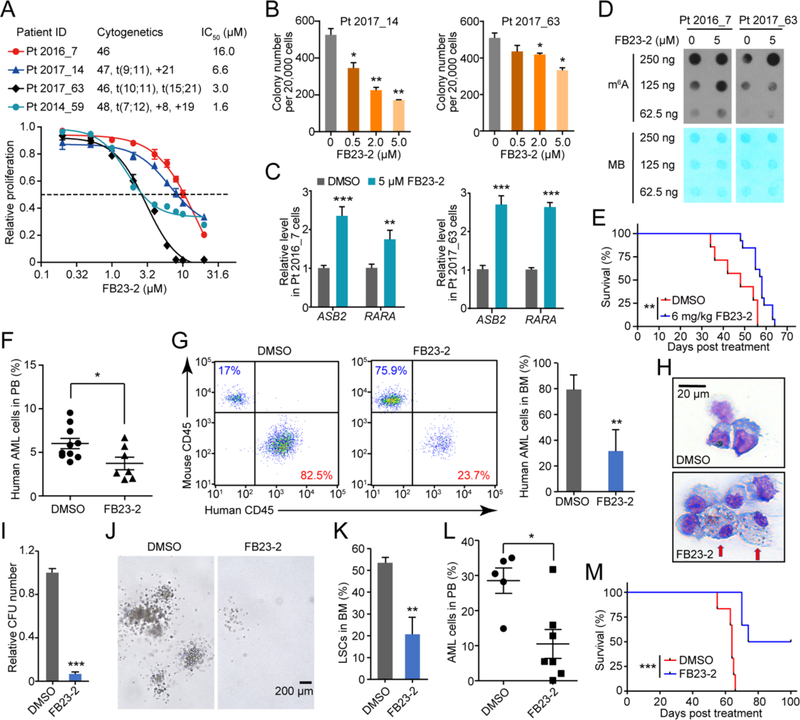
Figure 8. Therapeutic efficacy of FB23-2 in PDX mouse model.
(A) Effect of FB23-2 treatment of 96 hr on proliferation of primary BM cells collected from four leukemic patients. The proliferation is relative to vehicle group.
(B) Effect of FB23-2 on colony formation in AML patient cells for 12 days.
(C) Expression of ASB2 and RARA in control and 5 μM FB23-2 treated primary BM cells for 72 hr detected by RT-qPCR.
(D) Determination of m6A abundance in the poly(A)+ RNA samples upon FB23-2 treatment of 72 hr in primary BM cells via dot blot assay. The results are derived from two biological replicates.
(E) Kaplan-Meier analysis of patient AML cell-bearing NSGS mice with i.p. administration of DMSO (n = 7) or FB23-2 (n = 13). The BM sample from patient Pt 2017_63 was used for transplantation. The graph starts from the first day after transplantation.
(F and G) FACS analysis of the percentage of patient AML (human CD45+) cells in PB collected from PDX mice one day after the 17-day full treatment of DMSO (n = 10) or FB23-2 (n = 7) (F), and in BM collected when the mice became moribund (n = 3 – 4) (G).
(H) Wright-Giemsa staining to show the effect of FB23-2 on differentiation of human leukemia cells from primary PDX mice BM when the mice became moribund (n = 3 – 4). Arrows indicated differentiated cells.
(I-J) Relative CFUs (I) and morphology of colonies (J) of patient AML cells from primary PDX mice (n = 3 – 4).
(K) FACS analysis of the percentage of LSCs (human CD34+CD38− cells) in BM from primary PDX mice when they became moribund (n = 3 – 4).
(L) FACS analysis of the percentage of human AML cells (human CD45+) in PB isolated from the secondarily transplanted PDX mice 8 weeks post transplantation, which were reconstituted with the same number of leukemia cells from primary PDX mice treated with DMSO (n = 5) or FB23-2 (n = 7).
(M) Kaplan–Meier analysis of the secondary recipient mice transplanted with AML cells collected from primary PDX mice treated at indicated (n = 6).
*, p < 0.05; **, p < 0.01; ***, p < 0.001; unpaired Student’s t-test. Error bars, mean ± SEM; if not indicated, n = 3. See also Figure S6 and Table S8.

