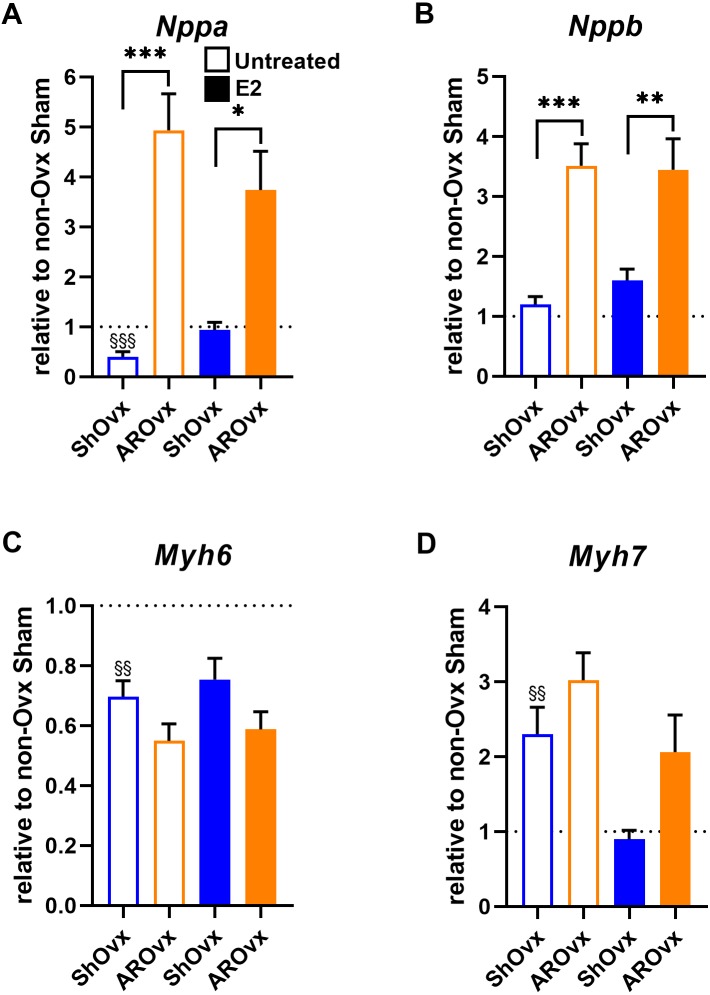
Figure 5. Evaluation by real-time quantitative RT-PCR of LV mRNA levels of genes encoding for hypertrophy markers in Sham Ovx and AR Ovx rats receiving (orange) or not (blue) 17beta-estradiol (E2) replacement.
(A) Nppa, (B) Nppb, (C) Myh6 and (D) Myh7. The results are reported as the mean ± SEM (n = 6/gr.) relative to non-Ovx Sham group (set to 1; dotted line). *: p < 0.05, **: p < 0.01 and between ***: p < 0.001 indicated groups. §§: p < 0.01 and §§§: p < 0.001 vs. non-ovx Sham group.

