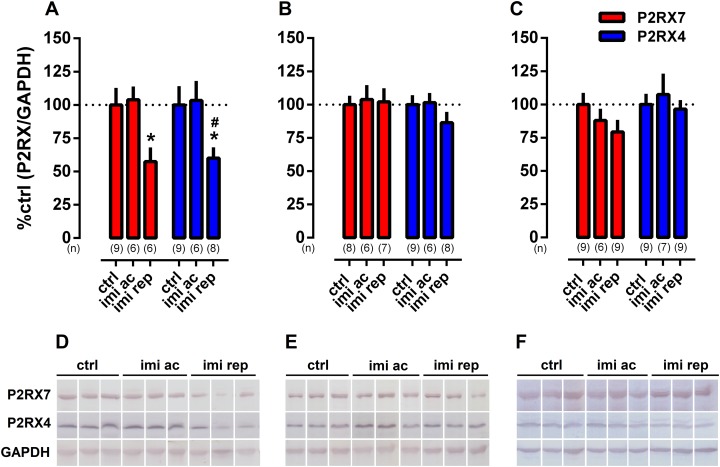
Figure 1. Effect of repeated treatment with imipramine on the levels of P2RX7 and P2RX4 in the (A) ventral hippocampus, (B) dorsal hippocampus and (C) frontal cortex.
Representative WB bands of (D) ventral hippocampus, (E) dorsal hippocampus and (F) frontal cortex. Values are expressed as mean ± SEM and the sample size of each experimental group (n) is depicted under the respective columns. *p < 0.05 from ctrl (vehicle-treated) group; #p < 0.05 from imi ac group.

