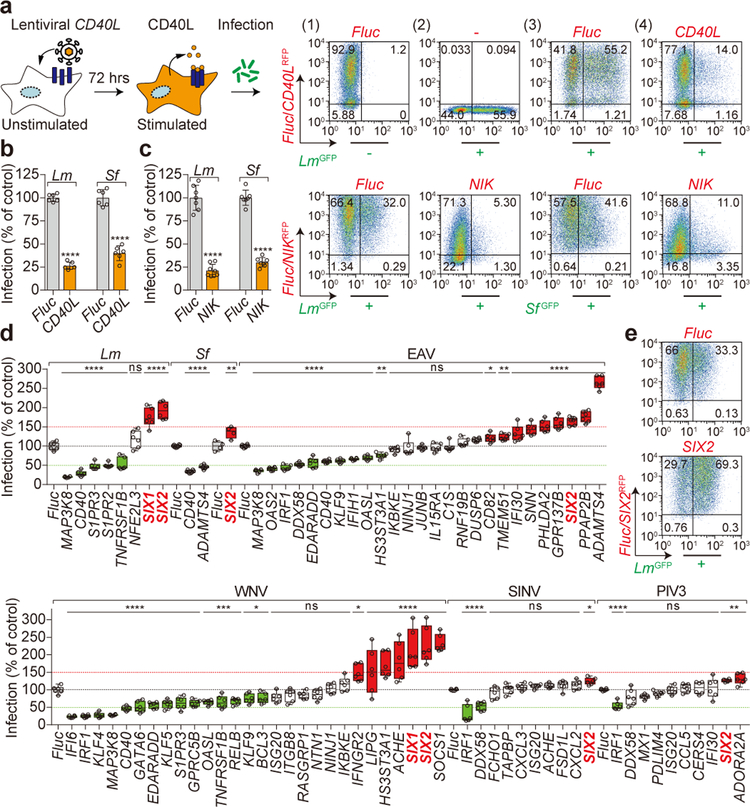
Figure 1. SIX-proteins exhibit immunomodulatory functions.
a, b, Diagram and data showing lentiviral delivery of CD40L/RFP into U-2 OS cells and its effect on GFP-expressing Lm infection. Representative flow cytometry scatter plots showing (1) luciferase (Fluc) RFP transduced uninfected cells, (2) untransduced LmGFP infected cells, (3) FlucRFP transduced cells infected with LmGFP, and (4) CD40LRFP transduced cells infected with LmGFP (a). Quantification of Lm and Sf infection of CD40L transduced cells as indicated (b). Bacterial infectivity was normalized to Fluc control (shown as 100%). Data are mean±s.d. from 6 independent experiments, ****P<0.0001, P values were derived from biological replicates using one-way ANOVA (GraphPad). The same statistics were applied to later studies unless otherwise stated. c, Fibroblasts transduced with Fluc or NIK lentivirus and then infected with GFP expressing Lm and Sf as indicated. Quantification of infection is presented as in b. Data are mean±s.d. from 6 independent experiments, ****P<0.0001. Representative flow cytometry scatter plots showing infection efficiency as described in a. d, Repeated trials of NIK-stimulated genes that inhibit (green) or enhance (red) infection by bacterial pathogens (Lm and Sf), +ssRNA viral pathogens (EAV: equine arteritis virus, WNV: West Nile virus, and SINV: Sindbis virus), and +ssRNA viral pathogen (PIV3: parainfluenza virus type 3). The relative percentage of pathogen infection was normalized to Fluc control (black dotted line). Data are presented as box and whisker plots, box is percentiles, black line is the population median, whiskers indicating the highest and lowest values (6 independent experiments). *P<0.05, **P<0.01, ***P<0.001, ****P<0.0001, ns: no significant difference. e, Representative flow cytometry scatter plots showing Lm infection efficiency in Fluc and SIX2 expressed fibroblasts as described in a. Data are representative of 6 independent experiments.

