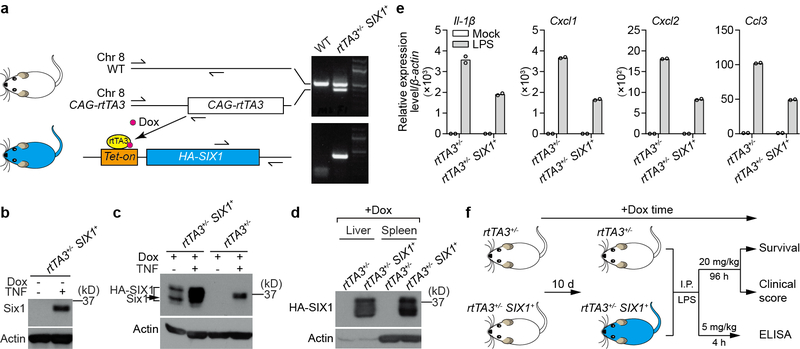
Extended Data Fig. 7. Doxycycline-induced HA-SIX1 expression in mice.
a, Schematic representation of the doxycycline-induced HA-SIX1 bitransgenic mouse model system. CAG-rtTA3 mice were intercrossed with Tet-on driven HA-SIX1 mice to obtain rtTA3+/−-SIX1+ mice. In principle, doxycycline bound rtTA3 targets the Tet-on operator and drives broad HA-SIX1 expression across multiple tissues. Primer sets used to genotype CAG-rtTA3 on chromosome 8 and Tet-on HA-SIX1 are shown. Electrophoresis gels shows genotyping of a representative rtTA3+/−-SIX1+ bitransgenic mouse. b, Anti-SIX1 western blot of whole cell lysates from BMDMs isolated from rtTA3+/−-SIX1+ mice. HA-SIX1 is not expressed in the absence of doxycycline under quiescent condition (left lane). TNF was administered to these cells as a control showing that endogenous murine Six1 is stimulated in these cells (right lane). c, Whole cell lysates from doxycycline treated BMDMs isolated from rtTA3+/− or rtTA3+/−-SIX1+ mice. BMDMs were stimulated with TNF, as indicated, and probed with anti-SIX1 antibody by western blot. Dox induced HA-SIX1 expression (lane 1), and this induction is potentiated by TNF (lane 2). We noted that HA-SIX1 ran as a doublet, which potentially represents unmodified and a mono-ubiquitinated form of the SIX1 protein. Neither endogenous Six1 nor HA-SIX1 was detected in BMDMs isolated from Dox treated rtTA3+/− mice (lane 3). In control experiments, TNF induced endogenous murine Six1 in BMDMs isolated from Dox treated rtTA3+/− mice (lane 4). d, HA-SIX1 is expressed in liver and spleen. rtTA3+/−-SIX1+ and rtTA3+/− mice were given 2 mg/ml doxycycline through drinking water for 10 days. Cell lysates from liver and spleen were used to probe HA-SIX1 expression by anti-SIX1 western blot. All western blot data are representative of 3 independent experiments. e, Peritoneal macrophages were isolated from rtTA3+/−-SIX1+ and rtTA3+/− littermate control mice. The adherent macrophages were incubated with 2 μg/ml doxycycline for 24 hours and then treated with mock or 100 ng/ml LPS for 4 hours. Total RNA was isolated for RT-qPCR. Relative gene expression was normalized to rtTA3+/− untreated control. Bars show mean from 2 technical replicates (shown as circles). Data are representative of 3 independent experiments. f, Diagram showing the experimental procedures corresponding to Fig. 4a–c. Further experimental details are provided in the methods section. For gel source data, see Supplementary Figure 1.

