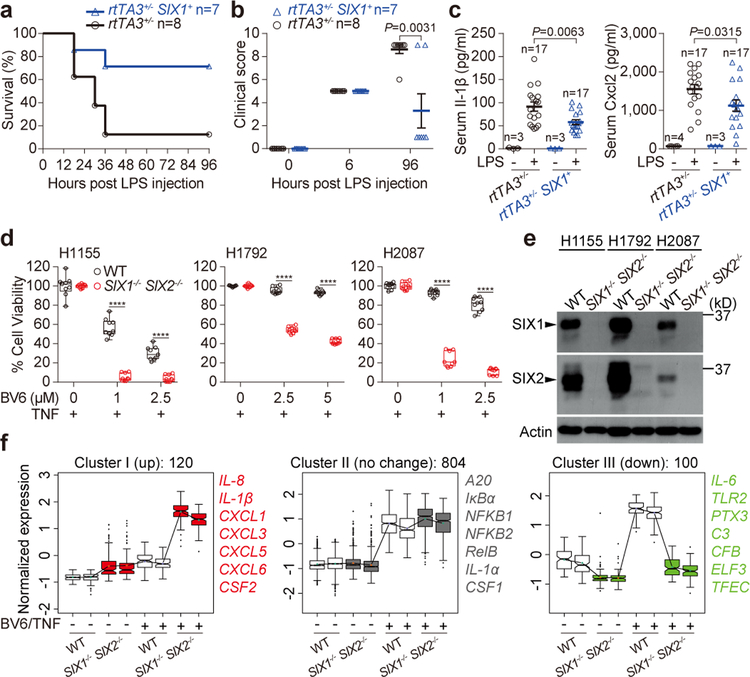
Figure 4. Physiological and pathological roles of the NIK-SIX signaling axis.
a, b, rtTA3+/− SIX1+ mice or littermate controls (rtTA3+/−) were challenged with LPS as described in Extended Data Fig. 7f. LPS-induced survival curve (a) and clinical score outcome (b) are representative of 3 independent experiments. The number of animals (n) are shown. Data are mean±s.e.m and P value was measured by two tailed unpaired Student’s t-test (b). c, serum Il-1β and Cxcl2 production in the indicated genotypes treated with LPS as described in Extended Data Fig. 7f. The number of animals (n) are shown. P value was measured by two tailed unpaired Student’s t-test. d, e, H1155 (left), H1792 (middle), or H2087 (right) cells were treated with 10 ng/ml TNF alone or in the presence of BV6 for 24 hours. Cell survival rate was normalized to the absence of BV6 control. Data are presented as box and whisker plots (9 independent experiments). Box is percentiles, line is the population median, and whiskers indicate the highest and lowest values. ****P<0.0001 (d). Western blot showing endogenous SIX1 and SIX2 expression in the indicated cells (e). Data are representative of 3 independent experiments. f, RNA-seq data from WT and SIX1−/− SIX2−/− H1792 cells treated with mock or 5 μM BV6 plus 25 ng/ml TNF for 24 hours. 1024 genes were significantly induced by BV6/TNF treatment in WT cells (statistical test is presented in methods). 120 out of 1024 genes were significantly upregulated (left), 804 genes were unchanged (middle), and 100 genes were downregulated (right) in SIX1−/− SIX2−/− cells. The representative genes were listed. Data are from 2 independent experiments and presented as box and whisker plots. Box is percentiles and line is the population median from the indicated number of genes. For gel source data, see Supplementary Figure 1.

