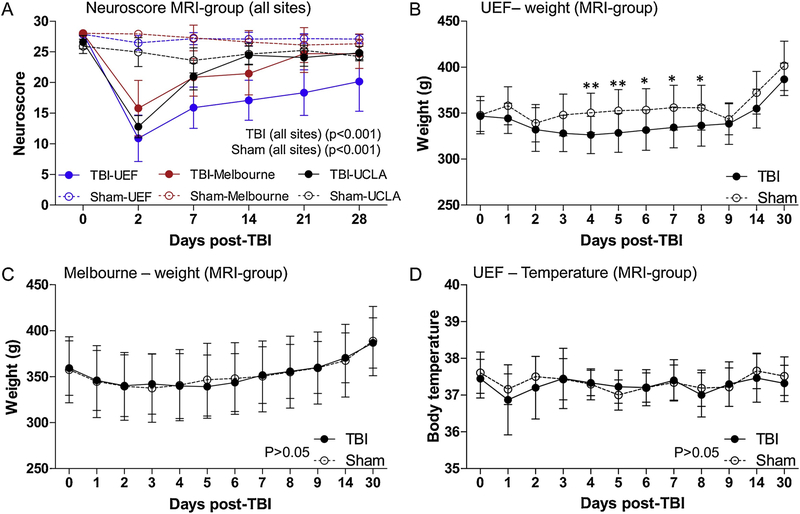
Fig. 2.
Line plot demonstrating progression of neuroscore, weight and body temperature after TBI. (A) The neuroscore for the MRI-group at the different sites. Note the variability in the neuroscore between the sites across time points. Repeated measure analysis of rats with complete neuroscore analysis (0–28 d) shows that the neuroscore over time is different between the sites. In addition, the neuroscore was different between the sites at individual time points (see also Table 2 for details). (B) Body weight follow-up of the MRI-group at UEF. The weight of the TBI rats decreased by 3 d post-injury, then recovered to control levels by 14 d post-TBI. (C) Body weight follow-up of rats in MRI-group in Melbourne. There was no difference in the post-injury weight progression between TBI and sham-operated rats at any time point, as assessed using the repeated measure ANOVA (RMA) (D) Temperature follow-up of MRI-group rats at UEF. RMA showed no difference in temperature between TBI and sham rats after TBI, at any time point. Data are presented as mean ± SD. *p < 0.05, **p < 0.01 (Mann-Whitney test).

