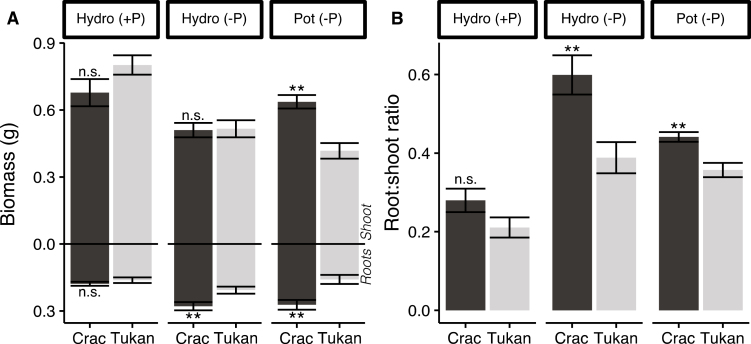
Fig. 2.
Growth rate of wheat cultivars Crac (dark bars) and Tukan (light bars) in sufficient Pi conditions (+P; 200 μM, hydroponically) and under Pi starvation (–P; 10 μM, hydroponically and in pots) harvested at Zadoks growth stage 23 (Zadoks et al., 1974). Graphics represent shoot and root biomass (A) and root:shoot ratio (B). Data represent the means of five independent replicates (±SE). n.s, non-significant differences. Asterisks indicate the significance of the differences between the cultivars in the same condition as determined by Student’s t-test: **P<0.01.

