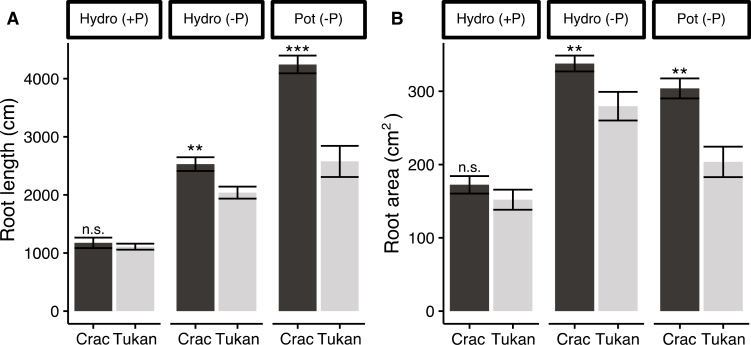
Fig. 3.
Root system architecture of wheat cultivars Crac (dark bars) and Tukan (light bars) grown in sufficient Pi condition (+P; 200 μM, hydroponically) and under Pi starvation (–P; 10 μM, hydroponically and in pots) harvested at Zadoks growth stage 23 (Zadoks et al., 1974). Graphics show total root length (A) and root surface area (B). Data represent the means of five independent replicates (±SE). n.s, non-significant differences. Asterisks indicate the significance of differences between the cultivars in the same condition as determined by Student’s t-test: **P<0.01, ***P<0.001.

