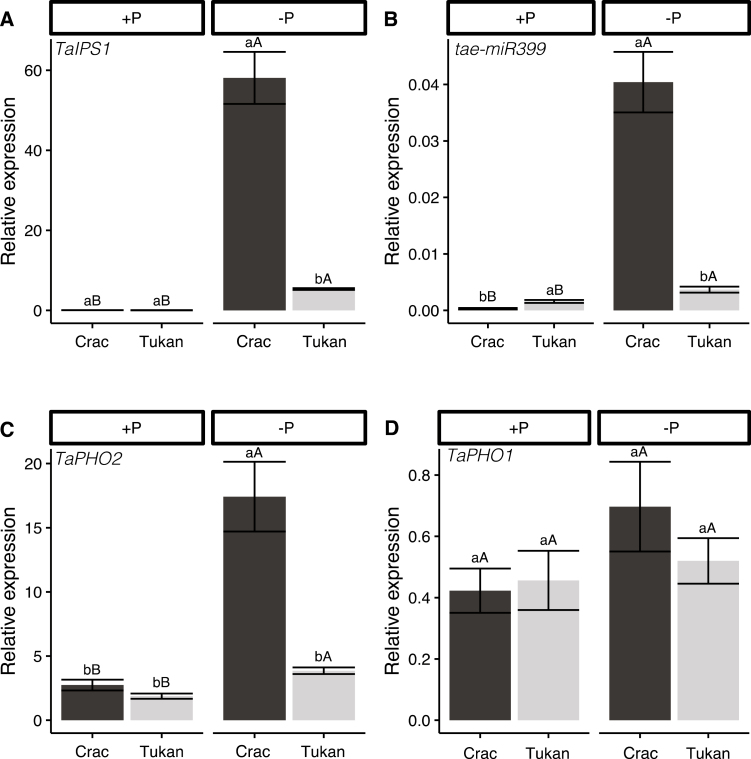
Fig. 5.
Expression levels of genes involved in P signalling and homeostasis in roots of Crac (dark bars) and Tukan (light bars) plants grown in nutrient solution with Pi (+P; 150 µM) and without Pi for the last week (–P) harvested at Zadoks growth stage 24 (Zadoks et al., 1974). Graphics represent gene expression of TaIPS1 (A), tae-miR399 (B), TaPHO2 (C), and TaPHO1 (D). Expression levels were referenced to the expression of the housekeeping gene TahnRNPQ. Bars represent the means of five independent replicates (±SE). Lower case letters indicate differences between cultivars in the same condition, and upper case letters indicate differences within the same cultivar under normal and deficient Pi conditions, as determined by Student’s t-test (P<0.05).

