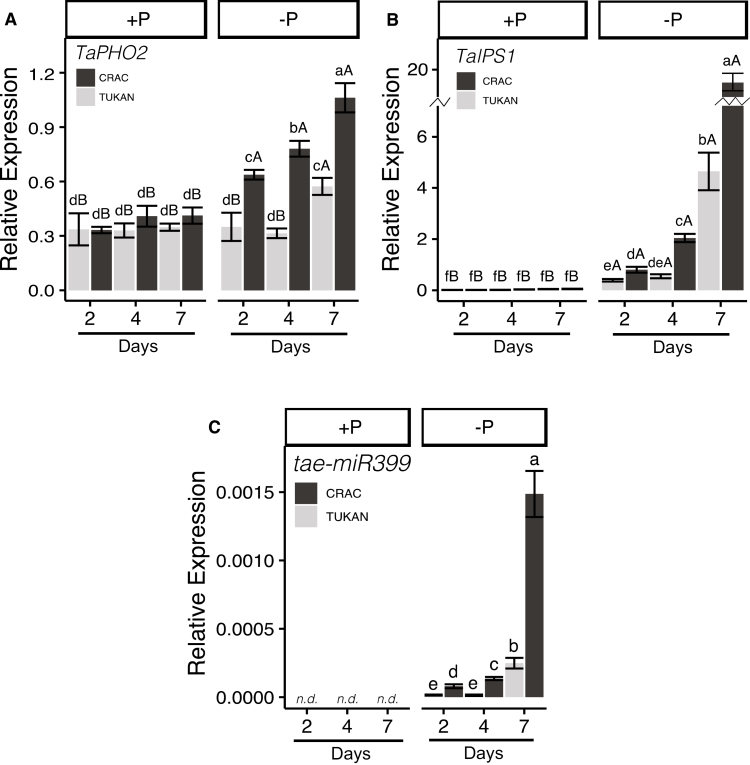
Fig. 6.
Expression levels of genes involved in P signalling and homeostasis in roots of Crac (dark bars) and Tukan (light bars) plants grown in nutrient solution with Pi (+P; 150 µM) and without Pi (–P) harvested after 2, 4, and 7 d of Pi deprivation. Graphics represent the expression of genes TaPHO2, TaIPS1, and tae-miR399. Expression levels were referenced to the expression of the housekeeping gene TahnRNPQ. Bars represent the means of five independent replicates (±SE). Lower case letters indicate differences between cultivars in the same condition, and upper case letters indicate differences within the same cultivar and day between +P and –P conditions, as determined by Student’s t-test (P<0.05). n.d, non-detected.

