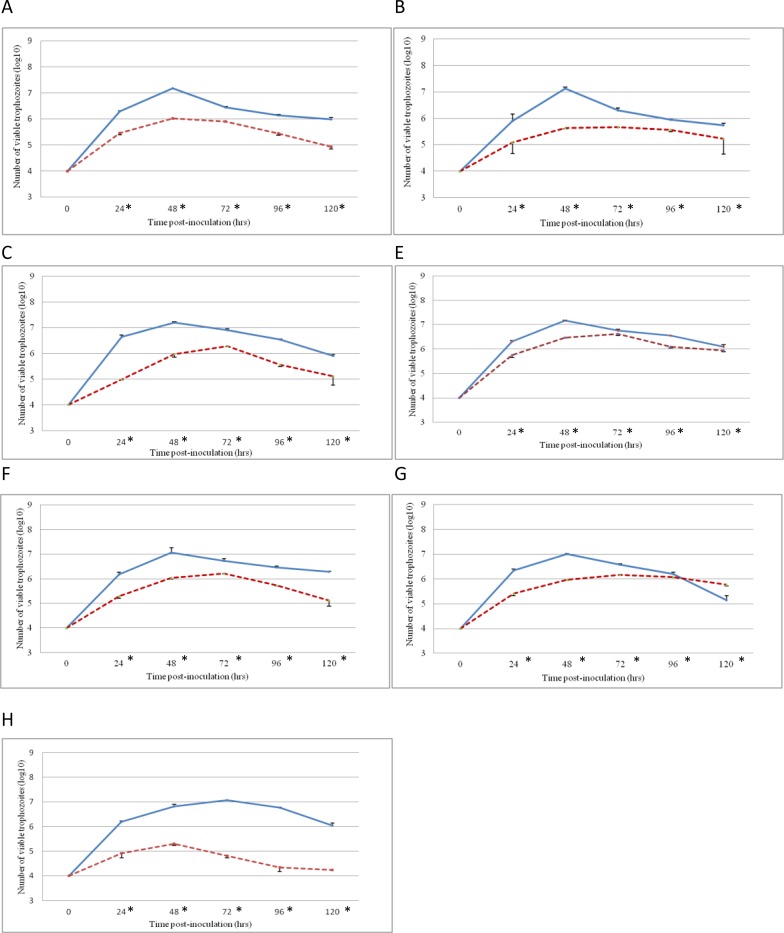
Fig 2. Growth curves of clones in LMH cells.
Growth curves of T. gallinae trophozoites from clonal cultures on LMH cells. Error bars indicate standard deviation. Control flasks containing only trophozoites without LMH cells are indicated in discontinuous lines. A) isolate P349-12 C11, B) isolate P95-13 C3, C) isolate R17-12 C3, D) isolate R193-13 C3, E) isolate P178-13 C7, F) R24-12 C10, G) isolate R44-12 C5. (*) Significant differences (p- value<0.05) between each clone and its control were observed in all the clones.

