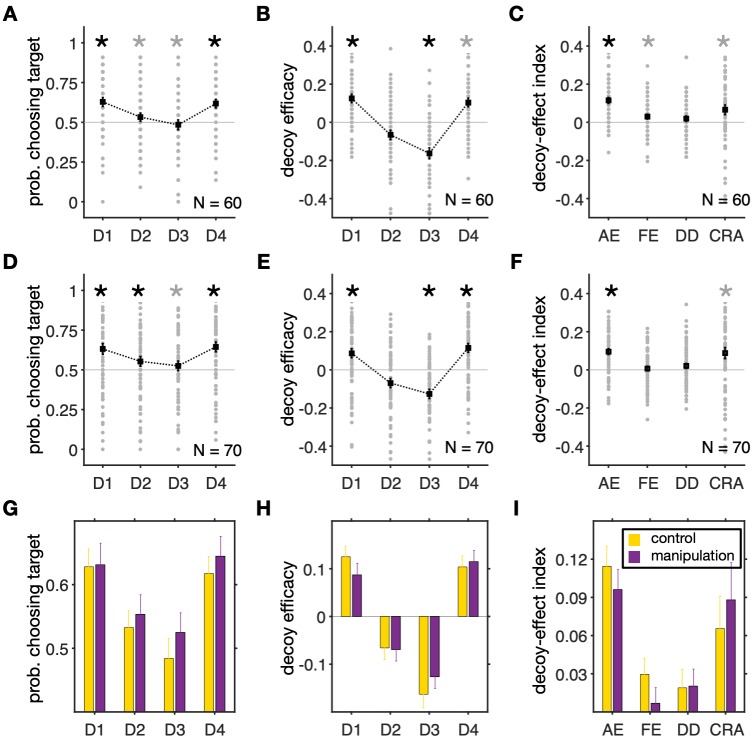
Fig 2. Preference was similarly influenced by decoys in the control and range-manipulation conditions.
(A) Probability of selecting the target for different decoy types during the control condition. Each gray circle shows the average probability that an individual subject selected the target for a given decoy location, and black squares indicate the average across all subjects. Error bars show the s.e.m., and an asterisk shows that the median of choice probability across subjects for a given decoy location is significantly different from 0.5 (two-sided Wilcoxon signed-test, p < 0.05). A gray asterisk indicates that the difference is not significant after Bonferroni correction. (B) Decoy efficacies measure the tendency to choose the target due to the presentation of decoys at a given location after subtracting the overall tendency to choose the target. An asterisk shows that the median of a given decoy efficacy across subjects is significantly different from zero (two-sided Wilcoxon signed-test, p < 0.05). Presentation of decoys resulted in change in preference in all locations. (C) Plot shows four measures for quantifying different effects of decoys on preference (AE: attraction effect; FE: frequency effect; DD: dominant vs. dominated; and CRA: change in risk aversion). Other conventions are similar to those in panel B. (D–F) The same as in A–C but for the range-manipulation condition. (G–I) Comparisons between the average target probabilities (G), decoy efficacies (H), and our four indices (I) in the two experimental conditions. Overall, there were no significant differences between the two experimental conditions based on choice probability, decoy efficacies, or any of our four measures (two-sided Wilcoxon rank-sum test, p > 0.05).

