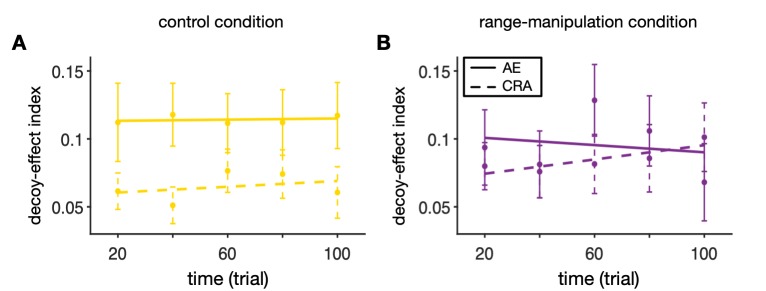
Fig 3. No significant difference between the time course of decoy effects in the control and range-manipulation conditions.
Plotted is time course of the overall attraction effect (AE) and the overall change in risk aversion (CRA) in the control (A) and range-manipulation conditions (B). Each point shows the average value of the respective measure during 40-trial bins around that point across all subjects. The error bar shows the s.e.m. The solid and dashed lines show the regression lines.

