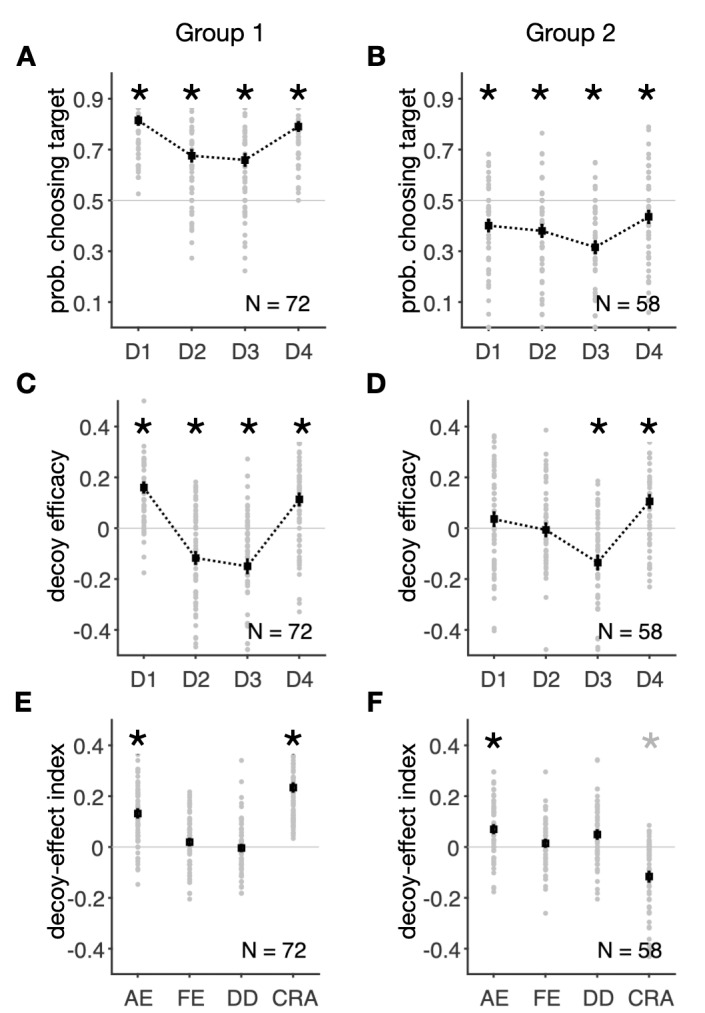
Fig 4. Distinct decoy effects in two groups of subjects identified by clustering based on all decoy-effect indices.

(A–B) Probability of selecting the target for different decoy types in the two groups of subjects identified by clustering. Conventions are the same as in Fig 2. Subjects in the first group (N = 72) selected the target with a probability larger than 0.5 for all decoy types (increased risk aversion), whereas subjects in the second group (N = 58) selected the target with a probability smaller than 0.5 (decreased risk aversion). An asterisk shows that the median of choice probability across subjects for a given decoy location is significantly different from 0.5 (two-sided Wilcoxon signed-test, p < 0.05). (C–D) Decoy efficacies in the two groups of subjects. An asterisk shows that the median of a given decoy efficacy across subjects is significantly different from zero (two-sided Wilcoxon signed-test, p < 0.05). Subjects in Group 1 exhibited strong, consistent decoy effects (C), whereas the decoy effects were inconsistent and limited to decoys next to the less risky gamble (target) in Group 2 (D). (E–F) Plot shows decoy-effect indices for individuals in the two groups of subjects. A gray asterisk indicates that the difference is not significant after Bonferroni correction. The first group showed a strong attraction effect and an overall increase in risk aversion. The second group showed a significant attraction effect and a decrease in risk aversion.
