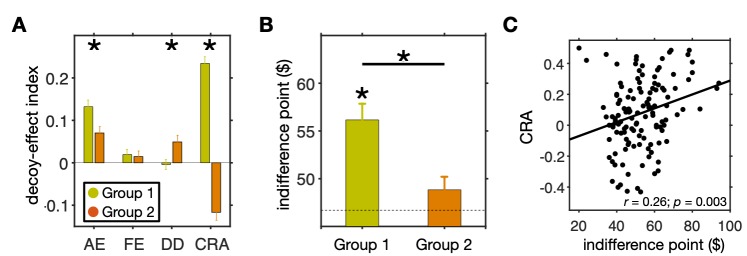
Fig 5. Comparison of the average decoy effects and original risk aversion between the two groups of subjects identified by clustering based on all four decoy-effect indices.
(A) Plot shows the mean (±std) of each measure separately for the two groups of subjects. An asterisk indicates that the difference between a given measure for the two groups is significant (two-sided Wilcoxon rank-sum test, p < 0.05). The two groups were different in terms of the overall attraction effect and the overall change in risk preference. (B) Comparison between the indifference points for the two groups of subjects. Plot shows the mean (±std) of the indifference point separately for the two groups of subjects and the dashed line indicates an indifference point of $46.70, corresponding to risk-neutrality. The asterisk above the bar shows a significant difference from $46.70 (two-sided Wilcoxon signed-rank test, p < 0.05), and the asterisk above the horizontal line indicates a significant difference between the two groups (two-sided Wilcoxon rank-sum test, p < 0.05). (C) Plotted is the change in risk aversion in the decoy task as a function of the indifference point in the estimation task. There was a significant correlation between these quantities indicating that individuals’ risk aversion in the binary choice influences their response to decoys.

