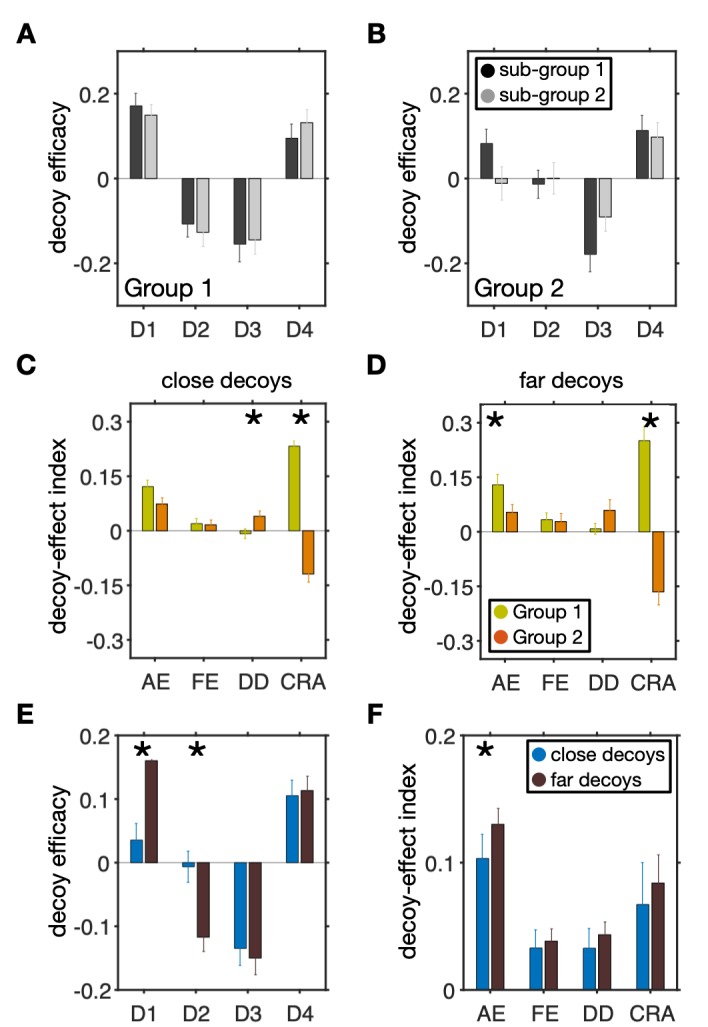
Fig 6. Distinct decoy effects in two groups of subjects identified by clustering do not depend on indifference points or distance of decoys.

(A–B) Comparisons between the decoy efficacies in sub-groups of subjects with small (sub-group 1) or large (sub-group 2) indifference points. Overall, there were no significant differences between decoy efficacies in the two subgroups of either Group 1 or Group 2 (two-sided Wilcoxon rank-sum test, p > 0.05). (C–D) Comparison of the decoy-effect indices between the two groups of subjects identified by clustering, separately for close (C) and far (D) decoys. Plots show the mean (±std) of each measure separately for the two groups of subjects. An asterisk indicates that the difference between a given measure for the two groups is significant (two-sided Wilcoxon rank-sum test, p < 0.05). (E–F) Comparison of decoy effects for close and far decoys across all subjects. Plots show the mean (±std) of decoy efficacy (E) and decoy-effect indices (F), separately for close and far decoys. An asterisk indicates that the difference between a given measure for the two conditions is significant (two-sided Wilcoxon rank-sum test, p < 0.05).
