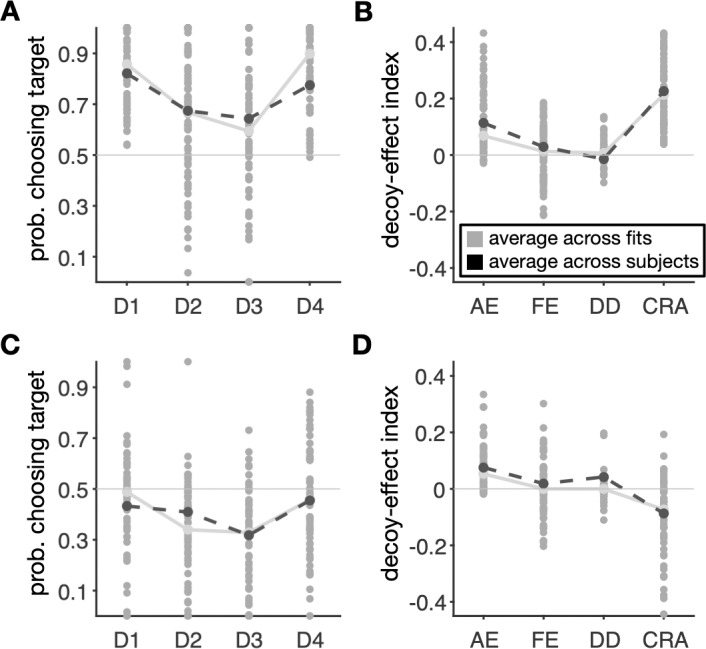
Fig 7. The model with both adjustments of value representation and competitive weighting of reward attributes can capture the experimental data.

(A, C) Each gray circle shows the predicted probability of selecting the target for different decoy types for individual subjects in the first (A) and second (C) groups using the best overall model. For comparison, the average values across subjects (black dashed line) and their predicted values (gray solid line) are plotted as well. (B, D) Plots show predicted decoy-effect indices for individual subjects in the first (B) and second (D) groups of subjects using the best overall model (AE: attraction effect; FE: frequency effect; DD: dominant vs. dominated; and CRA: change in risk aversion).
