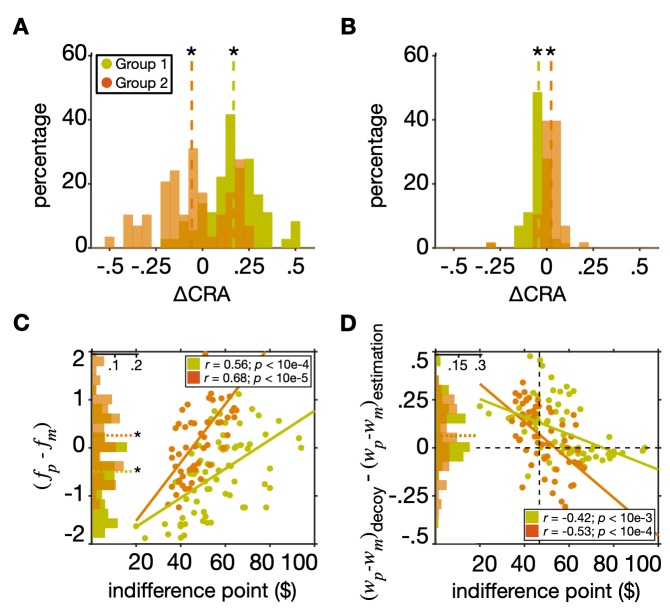
Fig 8. Adjustments of neural representations to decoy presentation and competitive weighting of reward attributes account for opposite patterns of change in risk preference.
(A) Plotted are the distributions of the difference in CRA between the models with and without adjustments of neural representations (i.e., explained CRA due to neural adjustments) separately for each group of subjects. The dashed lines show the medians and an asterisk shows a significant difference from zero (two-sided Wilcoxon signed-rank test, p < 0.05) (B) Plotted are the distributions of the difference in CRA between the models with and without competitive weighting of reward attributes (i.e., explained CRA due to competitive weighting) separately for each group of subjects. Both these models include adjustments of neural representations. (C) Plotted is the difference of estimated representation factor for probability and magnitude as a function of the indifference point. The green and orange histograms plot the fractions of subjects (green: Group 1; orange: Group 2) with certain values of Δf. (D) Plotted is the change in the differential weighting of reward probability and magnitude between the estimation and decoy tasks as a function of the indifference point. Adjustments of neural representations to decoy presentation and competitive weighting of reward attributes were both strongly correlated with the original degree of risk aversion. The vertical dashed line indicates the indifference point of $46.70, corresponding to risk-neutrality.

