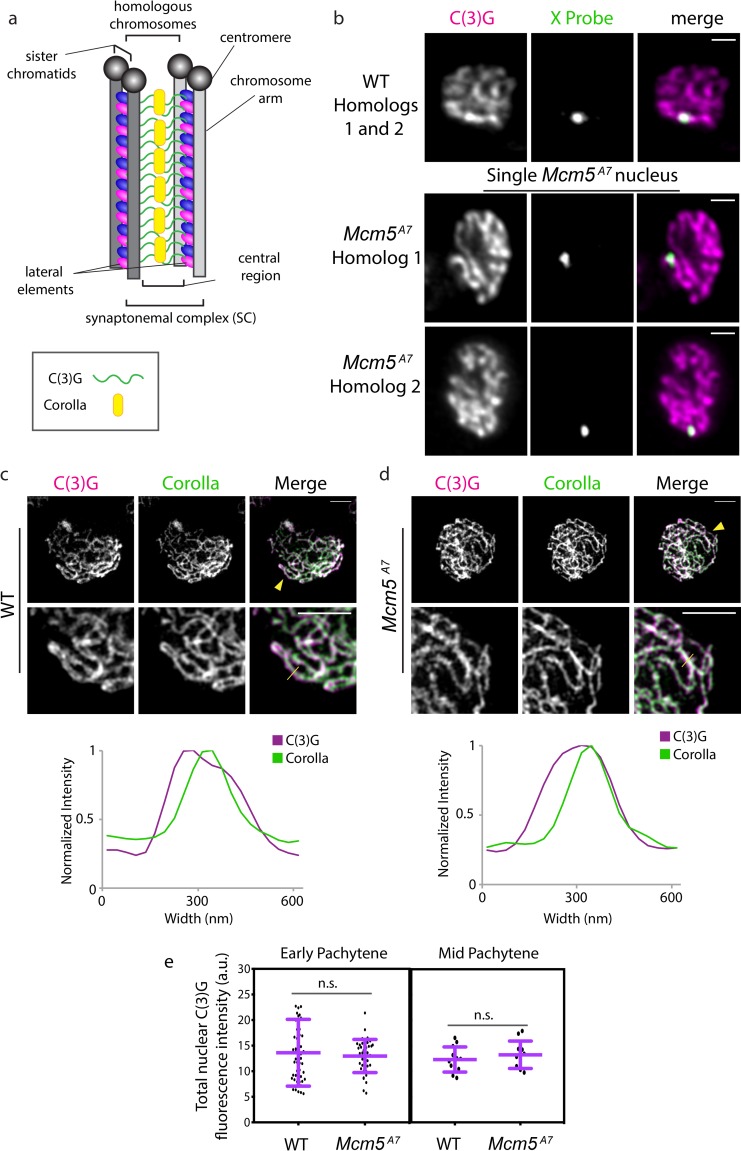
Fig 2. Synaptonemal complex exhibits no observable defects in Mcm5A7 mutants.
a. Schematic depiction of SC between two homologous chromosomes. The SC is composed of two lateral elements flanking a central region. The lateral elements are predecessors of the axial element, which is formed between sister chromatids and are composed of two cohesion complexes (blue and pink ovals). The central region consists, in part, of a C(3)G (green) dimer spanning the lateral elements, with pillar proteins such as Corolla (yellow) embedded within the central region. Enrichment of proteins at the centromere is not depicted. b. Super-resolution images of C(3)G and X-probe in WT (paired) and Mcm5A7 (unpaired) in whole-mount germaria, quantified in Fig 1. The images of Mcm5A7 are of the same nucleus but of different Z slices to capture both X-probes. Brightness and contrast have been adjusted for clarity. Scale bar = 1 μm. Refer to S1 and S2 Movies. c. Top: Representative image of C(3)G (magenta) and Corolla (green) in a WT meiotic chromosome spread. Brightness and contrast have been adjusted for clarity. Yellow arrowhead indicates area magnified in lower panel (middle). Scale bar = 2 μm. Middle: Magnification to detail the localization of C(3)G and Corolla. Scale bar = 2 μm. Yellow line indicates the area quantified for normalized intensity. Bottom: Normalized intensity of C(3)G and Corolla in a representative SC tract to demonstrate localization. d. Top: Representative image of C(3)G (magenta) and Corolla (green) in Mcm5A7 meiotic chromosome spread. Yellow arrowhead indicates area magnified in lower panel (middle). Scale bar = 2 μm. Middle: Magnification to detail the localization of C(3)G and Corolla. Scale bar = 2 μm. Yellow line indicates the area that was quantified for normalized intensity. Bottom: Normalized intensity of C(3)G and Corolla to demonstrate localization. e. Left panel: Quantification of nuclear C(3)G signal at early pachytene in WT (n = 52) and Mcm5A7 (n = 41) meiotic nuclei. p = 0.5601, unpaired T-test. Data are represented as mean ± SD. Right panel: Quantification of nuclear C(3)G signal in mid-pachytene in WT (n = 12) and Mcm5A7 (n = 11) meiotic nuclei. p = 0.3993, unpaired T-test. Data are represented as mean ± SD. Refer to S1 Fig for images and further analysis.

