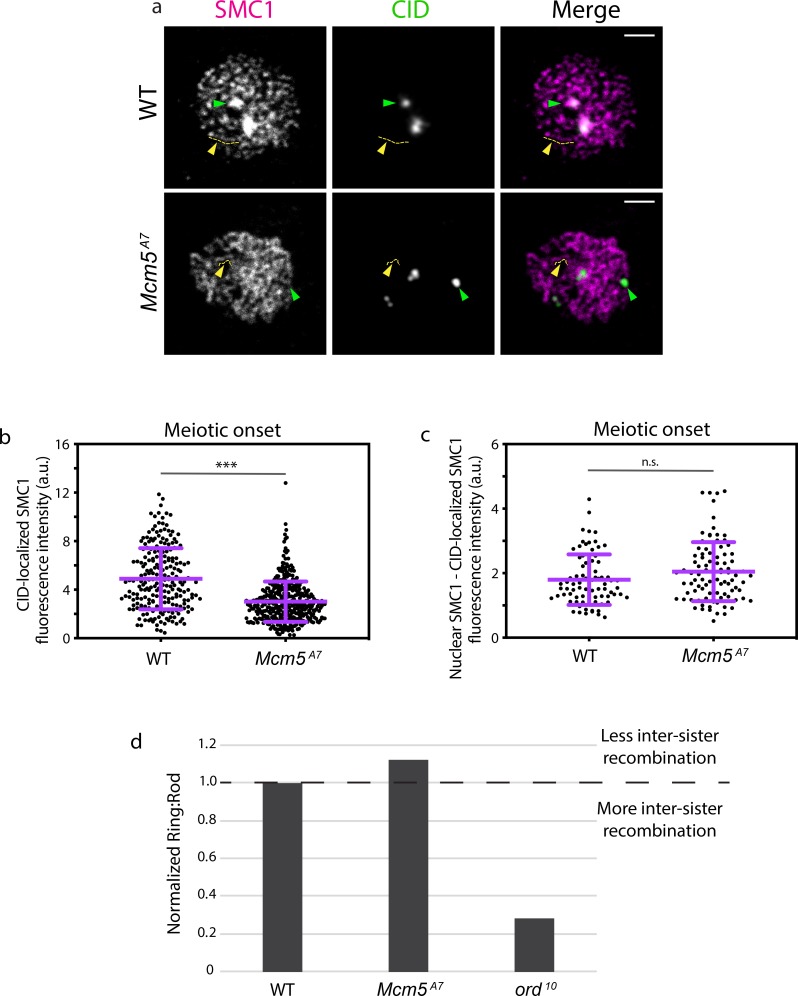
Fig 5. Centromeric SMC1 is significantly reduced in Mcm5A7 mutants.
a. Representative images of chromosome spreads in WT and Mcm5A7 meiotic nuclei examining localization of SMC1 (magenta) and CID (green). Green arrow: SMC1 enrichment at the centromere, yellow arrow and tract: SMC1 along the chromosome arm. Scale bar = 2 μm. Contrast and brightness of images were adjusted for clarity. b. Integrated SMC1 fluorescence intensity at CID foci in meiotic nuclei at meiotic onset (zygotene + early pachytene, Region 2A) at WT (n = 225) and Mcm5A7 (n = 398) meiotic centromeres. ***p < 0.0001, unpaired T-test. Data are represented as mean ± SD. c. CID-localized SMC1 fluorescence intensity subtracted from total nuclear SMC1 fluorescence in meiotic nuclei at meiotic onset (zygotene + early pachytene, Region 2A) in WT (n = 81) and Mcm5A7 (n = 93) meiotic nuclei. n.s. = 0.0548, unpaired T-test. Data are represented as mean ± SD. S3A Fig for representative images. d. Mcm5A7 (n = 1194) and ord10 (n = 250) mutants examined for inter-sister recombination through the ratio of Ring chromosome to Rod chromosome transmission. WT (n = 2574 for Mcm5A7 experiment, n = 1204 for Ord experiment) was normalized to 1. Ratios above 1 suggest less inter-sister recombination; ratios below 1 suggest more inter-sister recombination. Refer to S1 Table for complete dataset. For further details about the assay, see S3B–S3D Fig.

