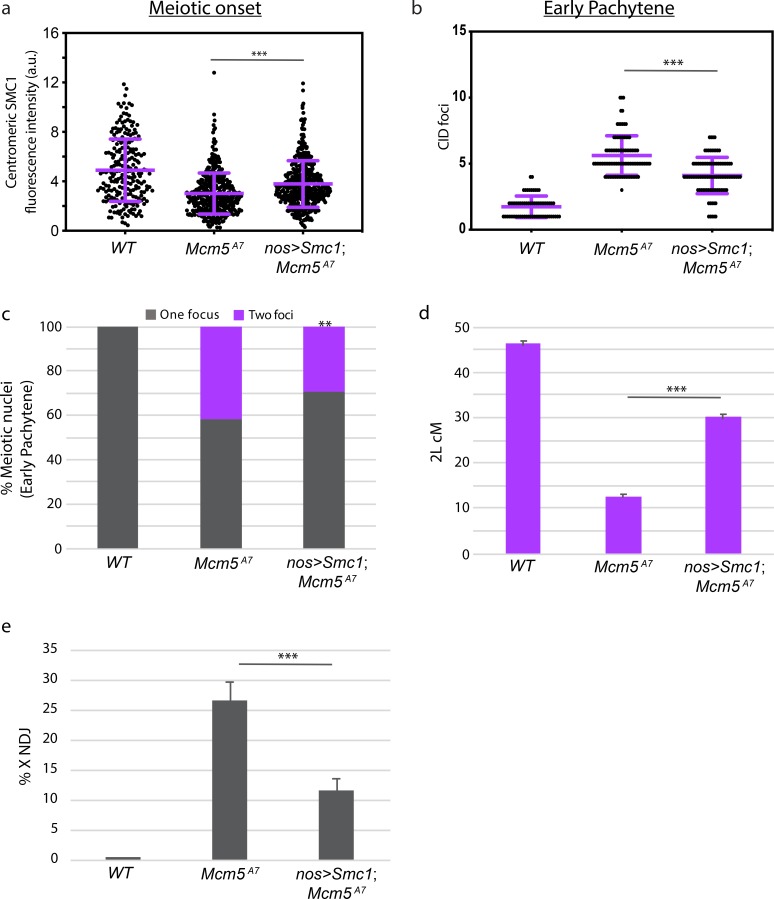
Fig 6. Overexpression of SMC1 in Mcm5A7 mutants rescue clustering, pairing, crossover formation, and NDJ.
a. Integrated SMC1 fluorescence intensity at WT, Mcm5A7, and nos>Smc1; Mcm5A7 (n = 427) meiotic centromeres at meiotic onset. See S4A Fig for representative images of nos>Smc1; Mcm5A7 nuclei. WT and Mcm5A7 data are repeated from Fig 5. ***p < 0.0001, unpaired T-test. Data are represented as mean ± SD. b. Number of centromeres (CID foci) in WT, Mcm5A7, and nos>Smc1; Mcm5A7 (n = 94) meiotic nuclei at early pachytene. WT and Mcm5A7 data are repeated from Fig 2. ***p < 0.0001, unpaired T-test. Data are represented as mean ± SD. c. Percent of total paired and unpaired in WT, Mcm5A7, and nos>Smc1; Mcm5A7 (total n = 169) nuclei at early pachytene, combining X-probe and 3R-probe data. WT and Mcm5A7 data are repeated from Fig 4 and are represented as X-probe plus 3R-probe early pachytene data. Significance comparing Mcm5A7 and nos>Smc1, Mcm5A7: **p = 0.0002, chi-square d. Crossover levels on chromosome 2L as shown in cM in WT (n = 4222) [54], Mcm5A7 (n = 2070), and nos>Smc1; Mcm5A7 (n = 933). ***p < 0.001, chi-square. Data are represented as mean ± 95% CI. Refer to S2 Table for full 2L crossover dataset. e. NDJ of the X chromosome in WT (0.07%, n = 3034), Mcm5A7 (26.5%, n = 1979), nos>Smc1; Mcm5A7 (11.5%, n = 2282). ***p < 0.0001 as calculated by [48]. Data are represented as mean ± 95% CI. Refer to S3 Table for full NDJ dataset.

