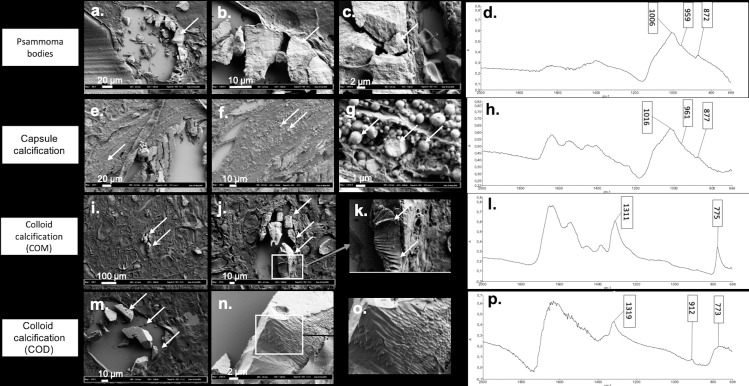
Fig 3. Illustration of the different patterns of crystals deposits in thyroid tissue using FE-SEM according to composition assessed by μFTIR spectrometry.
(a) (b) (c) Psammoma bodies with presence of growth lines in FE-SEM (a) arrow shows the psammoma body in FE-SEM, (b) and (c) arrows indicate the growth lines on the same psammoma body shown in (a), with a higher magnification), (d) FTIR absorption spectrum showing a mixture of CA and ACCP. (e) (f) (g) Capsule calcifications detected as an agglomeration of small spherules by FE-SEM (arrows show the same capsule calcification with different magnifications). (h) FTIR absorption spectrum showing a mixture of CA and ACCP. (i) (j) (k) COM, assessed by FTIR absorption (arrows show the same COM crystal on the three images with different magnifications). (l) appearing as overlapped sticks by FE-SEM. (m) (n) (o) COD with a pattern looking close to COM structure with overlapped sticks and sometimes perpendicular intersects (arrows show the COD crystals with different magnifications). (p) FTIR absorption spectrum of COD crystal.

