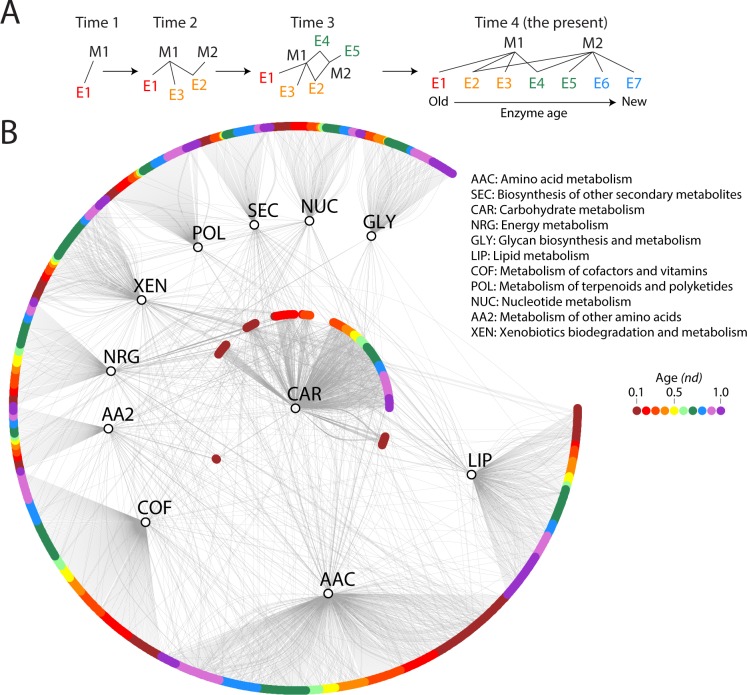
Fig 3. Evolution of the mesonetwork-enzyme bipartite network.
(A) Tracing enzyme ages on the bipartite networks, facilitates studying patterns of sharing and show the evolution of networks in time (B) A bipartite graph of mesonetworks and enzymes (nd = 1.0) showing enzymes by nd distribution on a scale of red to violet representing ancestral to recent fold family domain assignments. Mesonetworks are shown as vertices in black while colored nodes denote enzymes.

