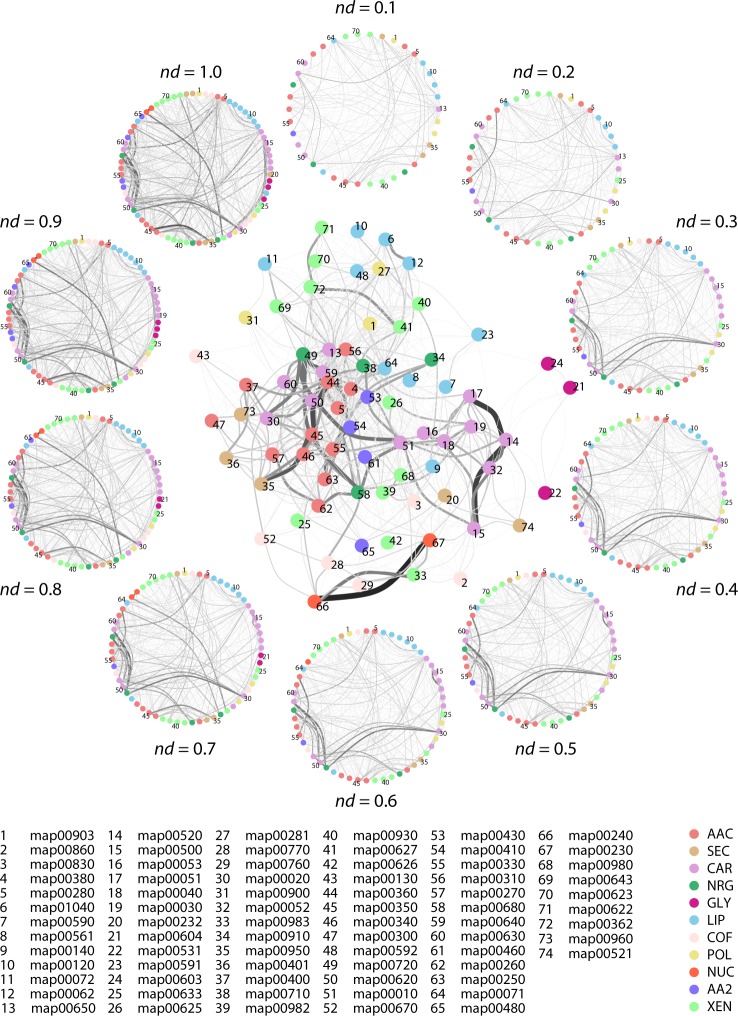
Fig 10. Evolution of metabolic networks visualized through the subnetwork one-mode projection of the subnetwork-enzyme bipartite network.
A reduced representation of the extant subnetwork one-mode projection (nd = 1.0) is shown in the middle. The reduced network projection shows major nodes (subnetworks) connecting to each other through links (shared enzymes). Greyscale values of links indicate the number of enzymes shared among the subnetworks. A full description of KEGG subnetwork labels can be found in S2 Table and S3 Table. The circle of networks describes a timeline of network growth for the subnetwork projection.

