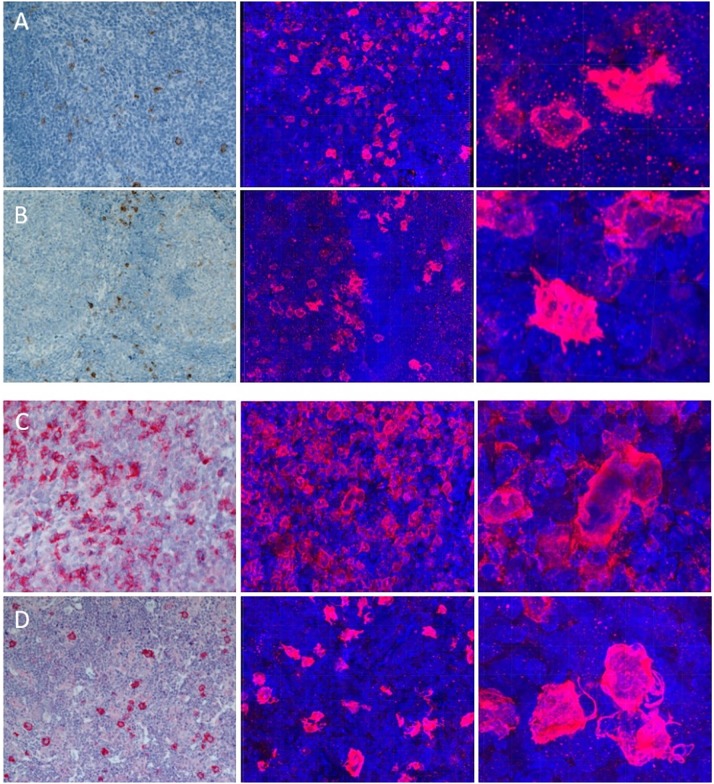
Fig 2. Comparison of conventional microscopy to confocal microscopy.
A to D show: AD (A), LAD (B), NScHL(C), MCcHL (D) in conventional microscopy (10x magn.). Next to them the same entities visualised by a confocal microscope (20x magn.). Note the network formation in NscHL (C) and filigree protrusions in MCcHL (D) in the detailed image cutouts (40x magn.).

