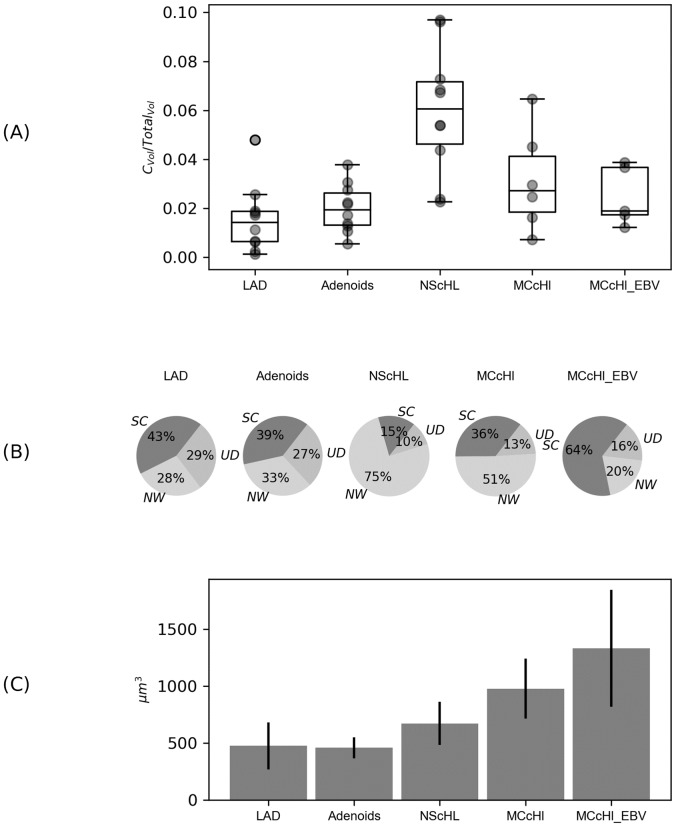
Fig 3. Comparison of CD30+ cell cytoplasm under reactive and neoplastic conditions.
(A) displays the percentage of the total amount of CD30+ cell cytoplasm and cell particles in tissue sections of different entities. (B) illustrates the percentages of CD30+ cytoplasm of networks (NW), single cells (SC) and undefined (UD) in the total of CD30+ volume for each entity of all cases (41). UD were not definable surfaces which mean cell fragments which were located at the edge of the cutout. Reactive Adenoids and LAD show nearly equal distribution. NScHL is dominated by networks whereas in MCcHL most of the CD30+ volume is allocated to single cells. (C) depicts the values for the average stained volumes of these single cell cytoplasm in μm3. The difference in size of CD30+ cell cytoplasm varies in the four entities. Cell networks are excluded. LAD, lymphadenitis; Adenoids; NScHL, Nodular Sclerosis classical Hodgkin Lymphoma; MCcHL, Mixed Cellularity classical Hodgkin Lymphoma; MCcHL EBV+, with EBV infection.

