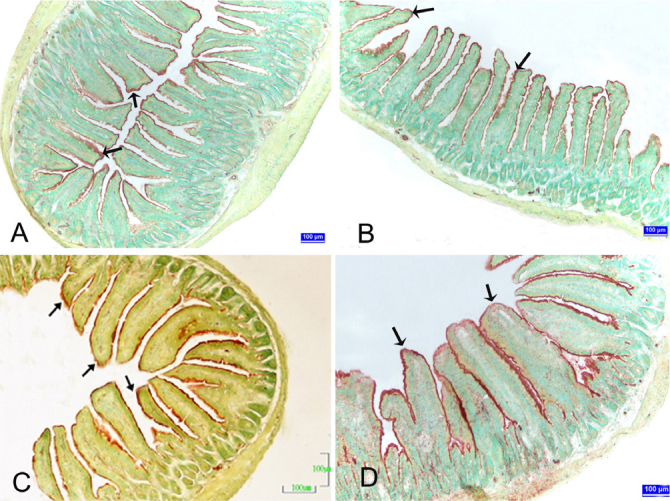
Figure 1. A–D.

Jejunum sections of the control and pregnant groups. (A) Control group, (B) first week of pregnancy, (C) second week of pregnancy, (D) third week of pregnancy Arrows: ALP reactivity. ALP demonstration. Bar: 100 μm.

Jejunum sections of the control and pregnant groups. (A) Control group, (B) first week of pregnancy, (C) second week of pregnancy, (D) third week of pregnancy Arrows: ALP reactivity. ALP demonstration. Bar: 100 μm.