. 2019 Oct 24;8:e47261. doi: 10.7554/eLife.47261

Figure 4. SND1 is a bona fide RNA-binding protein that targets transcripts bearing m6A modification.

(a) Most significantly enriched GO terms amongst the 5061 target RNAs (Ensembl transcripts) identified by RIP-seq which are consistently bound by SND1 at all time points (0 hr, 8 hr and 20 hr post-reactivation) in TREx BCBL1-Rta cells. FDR, false discovery rate. (b) Consistently bound SND1 RNA targets throughout the course of KSHV infection are enriched in m6A-modified RNAs, while non-targets are depleted. Target transcripts are defined by a fold change RIP/input > 2 while non-targets have a fold change input/RIP > 2. A false discovery rate (FDR) < 1% is applied to RIP-seq data. (c) Hierarchical clustering of fold change RIP/input for SND1 targets. (d) No significant correlation between the number of m6A peaks in a given RNA and the binding of SND1 as determined by log2 fold change RIP/input. Target transcripts with >300 mean reads of coverage per RNA were used for the analysis. Analysis using a lower expression cut-off showed similar results. (e, f) High-confidence SND1-bound genes (summarised at HGNC gene symbol annotation level) were defined using a cut-off of FDR < 1% and a fold change RIP/input > 2, while m6A peaks were detected using a FDR < 5% and > 1.5 fold m6A-IP reads over input reads. RNA targets and m6A peaks for YTH readers were mined from publically available PAR-CLIP and m6A-seq datasets from HeLa cells. (e) Overlap of target genes with m6A modifications between SND1 and heterologously expressed YTH reader proteins. (f) Overlap of target genes lacking m6A modifications between SND1 and heterologously expressed YTH reader proteins. (g) For SND1 localised enrichment analysis, introns are collapsed and exons spliced together into a single continuous RNA molecule. Spliced transcripts and introns are then segmented into transcriptomic regions based on changes in their fold change RIP/input. (h) Venn diagram showing the overlap between SND1 enrichment in coding region (CDS) and untranslated regions (UTRs) of SND1 target transcripts identified by localised enrichment analysis.

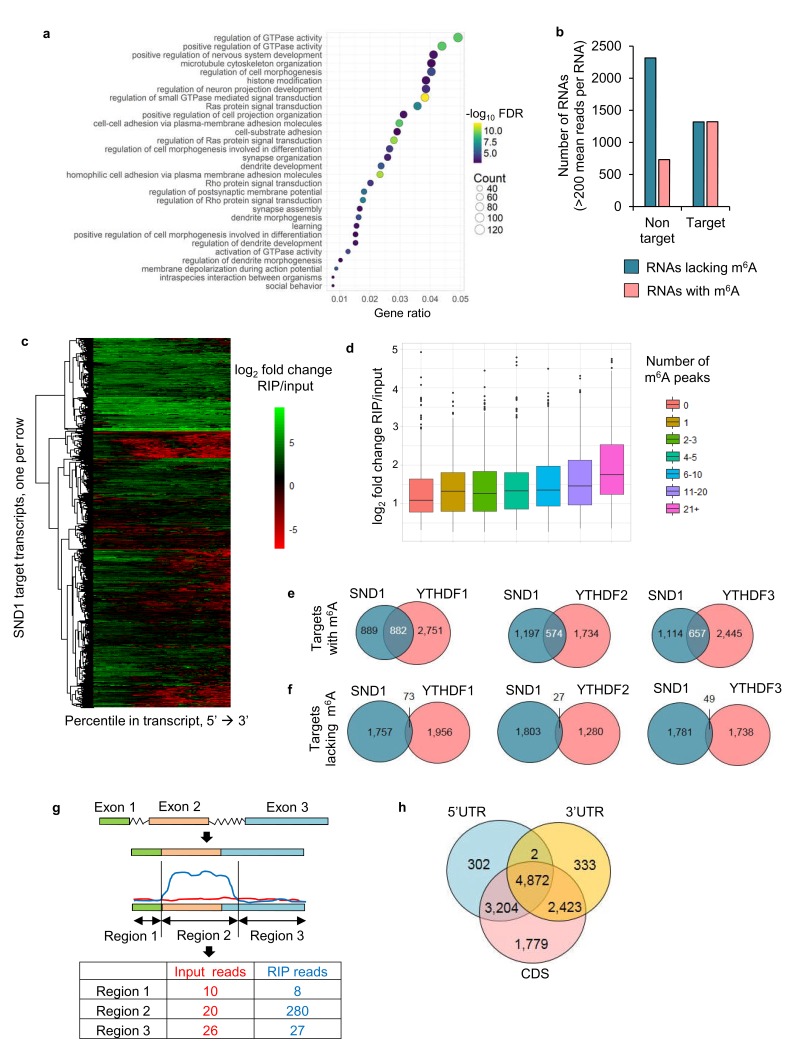
Figure 4.

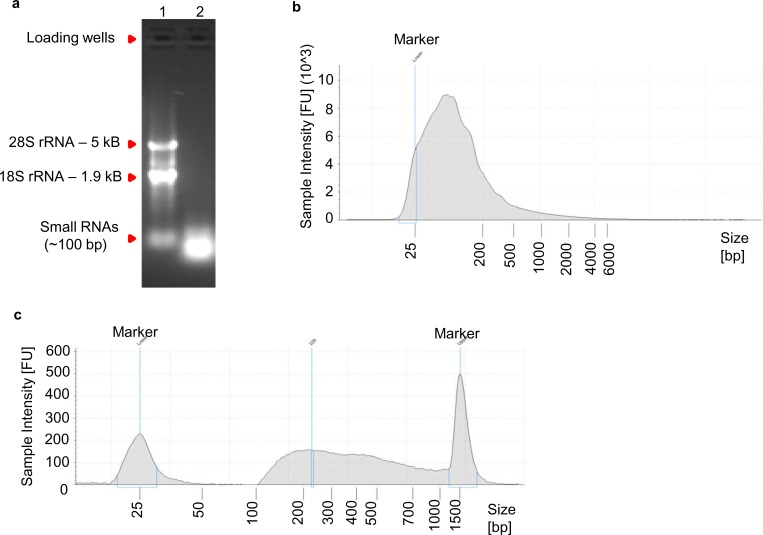
Figure 4—figure supplement 1. Long RNA fragments crosslinked to SND1 are enriched over shorter fragments during RIP.

Figure 4—figure supplement 1.

(a) Following sonication of formaldehyde-fixed TREx BCBL1-Rta cells, proteins were removed by proteinase K treatment and cross-links were reversed. Sonicated RNA was then isolated with Trizol LS and 1 µg was separated on a 1.2% (w/v) agarose gel containing 0.1 µg/ml of ethidium bromide. 1 µg of intact total RNA was used as a size marker. Lane one contained intact total RNA. Lane two contained sonicated total RNA. rRNA, ribosomal RNA. (b) 2200 TapeStation trace of sonicated total RNA (input) before RIP. The majority of the fragments are between 50 and 200 base pairs (bp) in length with a small tail of fragments of larger sizes (>500 bp). (c) 2200 TapeStation trace of cDNA library built from the immunoprecipitated RNA fragments after RIP. Note that the heat fragmentation step before cDNA synthesis was omitted to evaluate the true size of the immunoprecipitated RNA. Fragments smaller than 100 bp were totally depleted, in contrast a large tail of fragments that reached 1 kB in length was evident. Due to the large size of RNA fragments observed after SND1 immunoprecipitation, for all deep-sequencing of RIP samples used in this study, isolated RNA from RIP samples was fragmented for 7 min at 94°C before first strand synthesis.
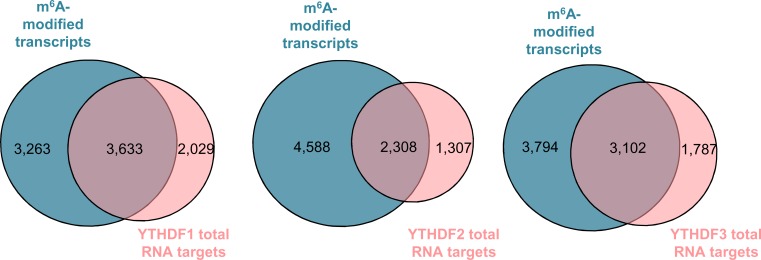
Figure 4—figure supplement 2. 65 % of all RNA targets of YTH readers contain m6A-modified transcripts.

Figure 4—figure supplement 2.

Overlaps between the total RNA targets identified by PAR-CLIP for each individual heterologously expressed YTH reader in HeLa cells with the subset of m6A-modified transcripts identified by m6A-seq in the same cell line. Publically available processed PAR-CLIP and m6A-seq datasets (Wang et al., 2014; Wang et al., 2015; Shi et al., 2017) were used for this analysis.
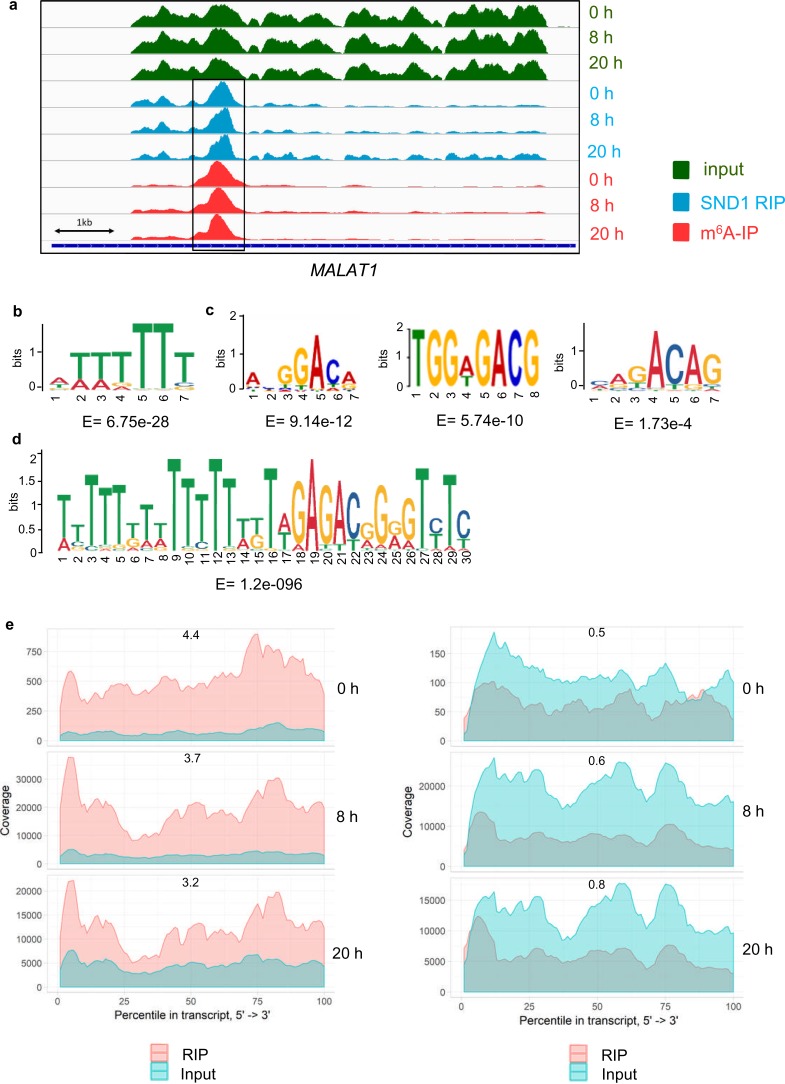
Figure 4—figure supplement 3. Bioinformatic analysis of SND1 RIP-seq data.

Figure 4—figure supplement 3.

(a) Genome sequencing tracks from latent (0 hr) and lytic (8 hr and 20 hr post-reactivation) TREx BCBL1-Rta cells depicting input (green) and RIP (blue) coverage. m6A-IP reads (red) are also shown. (b) The most enriched motif found in SND1-bound intronic enriched regions. (c) Significantly enriched motifs in SND1-bound intronic enriched regions. (d) A U-tract coupled to a DRm6ACH motif is significantly enriched in SND1-bound intronic regions that overlap m6A peaks. (e) Deep-sequencing coverage for input and RIP samples for ORF50 transcript (left panel) and ORF57 transcript (right panel) in latent (0 hr) and lytic TREx BCBL1-Rta cells reactivated for 8 hr and 20 hr. Note the significantly lower coverage for the lytic ORF50 and ORF57 transcripts during latency compared with lytic replication as expected. The fold change RIP/input for each time point is indicated.